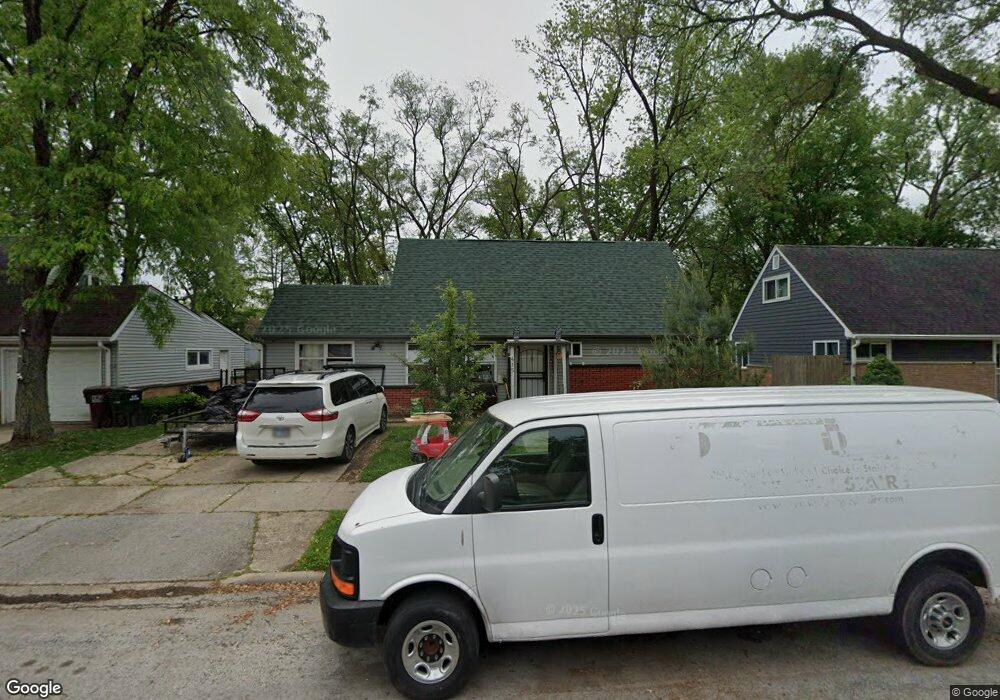
415 Winnemac St Park Forest, IL 60466
Estimated Value: $154,771 - $200,000
3
Beds
2
Baths
1,320
Sq Ft
$135/Sq Ft
Est. Value
About This Home
This home is located at 415 Winnemac St, Park Forest, IL 60466 and is currently estimated at $177,943, approximately $134 per square foot. 415 Winnemac St is a home located in Cook County with nearby schools including Michelle Obama School of Technology, Blackhawk Intermediate Center, and Barack Obama School of Leadership and STEM.
Ownership History
Date
Name
Owned For
Owner Type
Purchase Details
Closed on
Jul 8, 2011
Sold by
Tcf National Bank
Bought by
Rodriguez Galindo Rosalba
Current Estimated Value
Home Financials for this Owner
Home Financials are based on the most recent Mortgage that was taken out on this home.
Original Mortgage
$38,165
Interest Rate
4.64%
Mortgage Type
Seller Take Back
Purchase Details
Closed on
Nov 9, 2010
Sold by
Mcleod Henry C and Mcleod Henry
Bought by
Tcf National Bank
Purchase Details
Closed on
Mar 31, 2006
Sold by
Williams Terry Monte
Bought by
Mcleod Henry C
Home Financials for this Owner
Home Financials are based on the most recent Mortgage that was taken out on this home.
Original Mortgage
$102,350
Interest Rate
6.66%
Mortgage Type
Purchase Money Mortgage
Create a Home Valuation Report for This Property
The Home Valuation Report is an in-depth analysis detailing your home's value as well as a comparison with similar homes in the area
Home Values in the Area
Average Home Value in this Area
Purchase History
| Date | Buyer | Sale Price | Title Company |
|---|---|---|---|
| Rodriguez Galindo Rosalba | $45,000 | Attorneys Title Guaranty Fun | |
| Tcf National Bank | -- | Attorneys Title Guaranty Fun | |
| Mcleod Henry C | $115,000 | None Available |
Source: Public Records
Mortgage History
| Date | Status | Borrower | Loan Amount |
|---|---|---|---|
| Previous Owner | Rodriguez Galindo Rosalba | $38,165 | |
| Previous Owner | Mcleod Henry C | $102,350 |
Source: Public Records
Tax History Compared to Growth
Tax History
| Year | Tax Paid | Tax Assessment Tax Assessment Total Assessment is a certain percentage of the fair market value that is determined by local assessors to be the total taxable value of land and additions on the property. | Land | Improvement |
|---|---|---|---|---|
| 2024 | $7,089 | $13,000 | $2,625 | $10,375 |
| 2023 | $3,311 | $13,000 | $2,625 | $10,375 |
| 2022 | $3,311 | $5,884 | $2,438 | $3,446 |
| 2021 | $3,368 | $5,883 | $2,437 | $3,446 |
| 2020 | $3,345 | $5,883 | $2,437 | $3,446 |
| 2019 | $3,876 | $6,990 | $2,250 | $4,740 |
| 2018 | $3,729 | $6,990 | $2,250 | $4,740 |
| 2017 | $3,768 | $6,990 | $2,250 | $4,740 |
| 2016 | $4,920 | $7,446 | $2,062 | $5,384 |
| 2015 | $4,686 | $7,446 | $2,062 | $5,384 |
| 2014 | $4,600 | $7,446 | $2,062 | $5,384 |
| 2013 | $6,205 | $7,345 | $2,062 | $5,283 |
Source: Public Records
Map
Nearby Homes
- 408 Westgate Dr
- 197 Washington St
- 433 Wildwood Dr
- 505 Wildwood Dr
- 363 Winnebago St
- 506 Wildwood Dr
- 109 Walnut St
- 510 Wildwood Dr
- 21945 Millard Ave
- 216 Washington St
- 354 Winona St
- 3704 Linden Rd
- 124 Wilson St
- 403 Wilshire St
- 409 Wilshire St
- 413 Wilshire St
- 574 Lakewood Blvd
- 569 Lakewood Blvd
- 406 Sauk Trail
- 4083 Appleby Ct
- 413 Winnemac St
- 417 Winnemac St
- 412 Watseka St
- 411 Winnemac St
- 410 Watseka St
- 414 Watseka St
- 416 Watseka St
- 418 Winnemac St
- 408 Watseka St
- 420 Winnemac St
- 416 Winnemac St
- 189 Washington St
- 191 Washington St
- 422 Winnemac St
- 414 Winnemac St
- 406 Watseka St
- 193 Washington St
- 187 Washington St
- 412 Winnemac St
- 407 Winnemac St