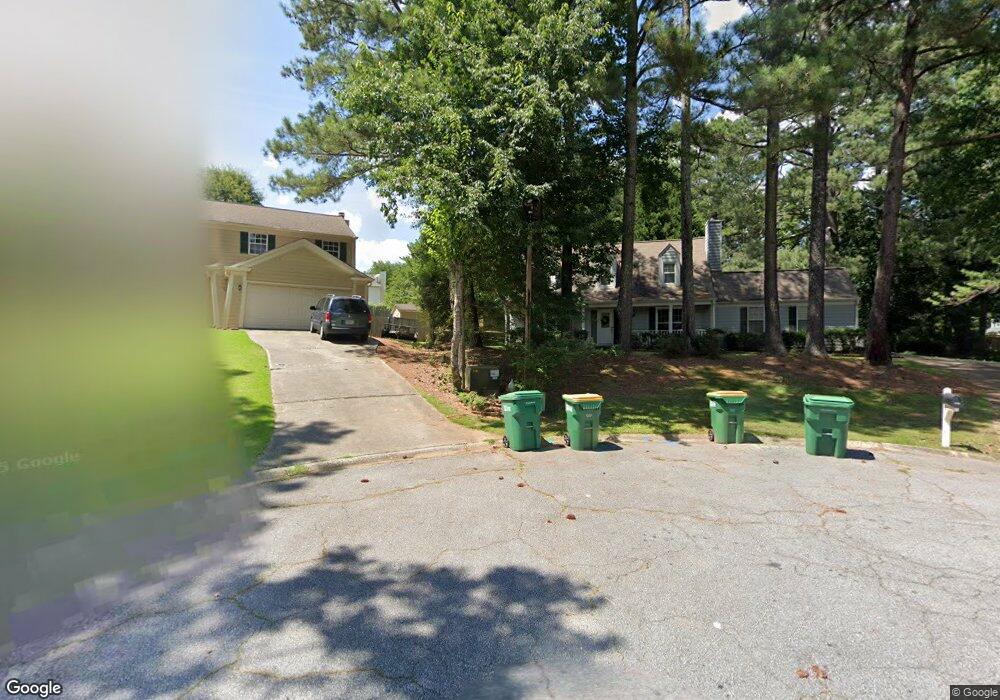
4150 Mary Walk Norcross, GA 30092
Estimated Value: $486,308 - $547,000
3
Beds
2
Baths
1,716
Sq Ft
$303/Sq Ft
Est. Value
About This Home
This home is located at 4150 Mary Walk, Norcross, GA 30092 and is currently estimated at $519,827, approximately $302 per square foot. 4150 Mary Walk is a home located in Gwinnett County with nearby schools including Simpson Elementary School, Pinckneyville Middle School, and Norcross High School.
Ownership History
Date
Name
Owned For
Owner Type
Purchase Details
Closed on
Jan 25, 2008
Sold by
Gwaltney Douglas L
Bought by
Gwaltney Douglas L and Gwaltney Kellie
Current Estimated Value
Home Financials for this Owner
Home Financials are based on the most recent Mortgage that was taken out on this home.
Original Mortgage
$232,000
Outstanding Balance
$144,724
Interest Rate
5.85%
Mortgage Type
New Conventional
Estimated Equity
$375,103
Purchase Details
Closed on
Apr 1, 1994
Sold by
Chestnut Carol D
Bought by
Zych Jennifer B
Home Financials for this Owner
Home Financials are based on the most recent Mortgage that was taken out on this home.
Original Mortgage
$96,300
Interest Rate
7.61%
Create a Home Valuation Report for This Property
The Home Valuation Report is an in-depth analysis detailing your home's value as well as a comparison with similar homes in the area
Home Values in the Area
Average Home Value in this Area
Purchase History
| Date | Buyer | Sale Price | Title Company |
|---|---|---|---|
| Gwaltney Douglas L | $232,000 | -- | |
| Gwaltney Douglas L | $232,000 | -- | |
| Zych Jennifer B | $108,000 | -- |
Source: Public Records
Mortgage History
| Date | Status | Borrower | Loan Amount |
|---|---|---|---|
| Open | Gwaltney Douglas L | $232,000 | |
| Previous Owner | Zych Jennifer B | $96,300 |
Source: Public Records
Tax History Compared to Growth
Tax History
| Year | Tax Paid | Tax Assessment Tax Assessment Total Assessment is a certain percentage of the fair market value that is determined by local assessors to be the total taxable value of land and additions on the property. | Land | Improvement |
|---|---|---|---|---|
| 2024 | $4,388 | $149,240 | $36,400 | $112,840 |
| 2023 | $4,388 | $149,240 | $36,400 | $112,840 |
| 2022 | $3,990 | $129,840 | $32,800 | $97,040 |
| 2021 | $3,771 | $115,720 | $26,240 | $89,480 |
| 2020 | $3,668 | $109,880 | $26,000 | $83,880 |
| 2019 | $3,560 | $109,880 | $26,000 | $83,880 |
| 2018 | $3,323 | $98,520 | $24,000 | $74,520 |
| 2016 | $2,763 | $78,480 | $24,000 | $54,480 |
| 2015 | $2,794 | $78,480 | $24,000 | $54,480 |
| 2014 | -- | $76,040 | $24,000 | $52,040 |
Source: Public Records
Map
Nearby Homes
- 5440 Clinchfield Trail
- 5221 W Jones Bridge Rd
- 5350 Wickershire Dr
- 5545 Fitzpatrick Terrace
- 5397 Valley Mist Ct
- 5465 Fort Fisher Way
- 5465 Fort Fisher Way
- 4531 Outer Bank Dr
- 5649 Whitesburg Ct
- 5885 Match Point
- 5354 Fox Hill Dr
- 5863 Revington Dr
- 5961 Ranger Ct
- 5201 Edgerton Dr
- 5786 Broxton Cir
- 5206 Creek Walk Cir
- 3962 Gunnin Rd
- 4160 Mary Walk
- 4191 Mary Walk
- 4731 Jones Bridge Cir
- 4741 Jones Bridge Cir
- 4721 Jones Bridge Cir
- 4242 Caleb Ct
- 4232 Caleb Ct
- 4201 Mary Walk
- 4252 Caleb Ct
- 4170 Mary Walk
- 4251 Walden Ct
- 4222 Caleb Ct Unit 10
- 4711 Jones Bridge Cir Unit 8
- 4711 Jones Bridge Cir
- 0 Caleb Ct Unit 7179049
- 0 Caleb Ct Unit 8498555
- 0 Caleb Ct Unit 8807826
- 0 Caleb Ct Unit 8779911
- 0 Caleb Ct
- 4180 Mary Walk