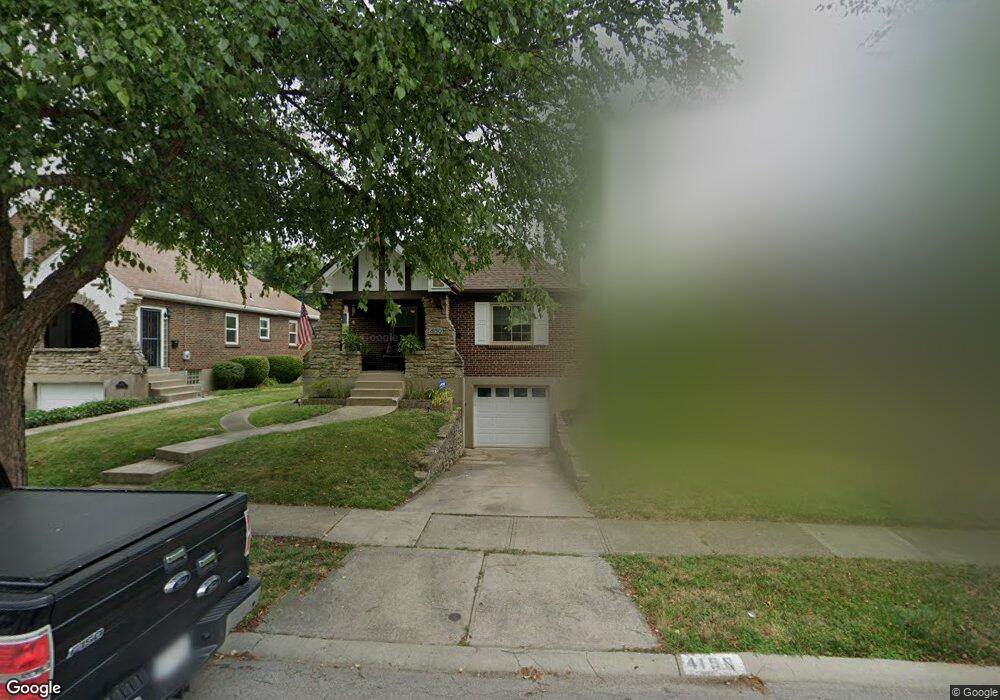
4150 Sherel Ln Cincinnati, OH 45209
Oakley NeighborhoodEstimated Value: $330,939 - $347,000
2
Beds
1
Bath
1,084
Sq Ft
$311/Sq Ft
Est. Value
About This Home
This home is located at 4150 Sherel Ln, Cincinnati, OH 45209 and is currently estimated at $337,485, approximately $311 per square foot. 4150 Sherel Ln is a home located in Hamilton County with nearby schools including Clark Montessori High School, Shroder High School, and Withrow University High School.
Ownership History
Date
Name
Owned For
Owner Type
Purchase Details
Closed on
Aug 19, 2024
Sold by
Hecker Timothy F and Hawk Angie
Bought by
Sprouse Justin and Hecker Rachel
Current Estimated Value
Home Financials for this Owner
Home Financials are based on the most recent Mortgage that was taken out on this home.
Original Mortgage
$368,207
Outstanding Balance
$362,285
Interest Rate
6.49%
Mortgage Type
FHA
Estimated Equity
-$24,800
Purchase Details
Closed on
May 21, 2014
Sold by
Cozzi Brandon M and Cozzi Amy L
Bought by
Hecker Timothy F
Home Financials for this Owner
Home Financials are based on the most recent Mortgage that was taken out on this home.
Original Mortgage
$170,800
Interest Rate
4.28%
Mortgage Type
New Conventional
Create a Home Valuation Report for This Property
The Home Valuation Report is an in-depth analysis detailing your home's value as well as a comparison with similar homes in the area
Home Values in the Area
Average Home Value in this Area
Purchase History
| Date | Buyer | Sale Price | Title Company |
|---|---|---|---|
| Sprouse Justin | $375,000 | None Listed On Document | |
| Hecker Timothy F | $213,500 | Attorney |
Source: Public Records
Mortgage History
| Date | Status | Borrower | Loan Amount |
|---|---|---|---|
| Open | Sprouse Justin | $368,207 | |
| Previous Owner | Hecker Timothy F | $170,800 |
Source: Public Records
Tax History
| Year | Tax Paid | Tax Assessment Tax Assessment Total Assessment is a certain percentage of the fair market value that is determined by local assessors to be the total taxable value of land and additions on the property. | Land | Improvement |
|---|---|---|---|---|
| 2025 | $5,752 | $93,363 | $49,130 | $44,233 |
| 2023 | $5,703 | $93,363 | $49,130 | $44,233 |
| 2022 | $5,458 | $80,136 | $34,685 | $45,451 |
| 2021 | $5,252 | $80,136 | $34,685 | $45,451 |
| 2020 | $5,407 | $80,136 | $34,685 | $45,451 |
| 2019 | $4,926 | $66,780 | $28,903 | $37,877 |
| 2018 | $4,933 | $66,780 | $28,903 | $37,877 |
| 2017 | $4,686 | $66,780 | $28,903 | $37,877 |
| 2016 | $5,316 | $74,726 | $25,015 | $49,711 |
| 2015 | $4,793 | $74,726 | $25,015 | $49,711 |
| 2014 | $4,827 | $74,726 | $25,015 | $49,711 |
| 2013 | $4,280 | $65,101 | $24,287 | $40,814 |
Source: Public Records
Map
Nearby Homes
- 4024 Marburg Ave
- 3437 Cardiff Ave
- 3511 Cardiff Ave
- 3408 Brotherton Rd
- 4109 Marburg Ave
- 4153 Paxton Woods Ln
- 4136 Paxton Woods Dr
- 3327 Brotherton Rd
- 3259 Berwyn Place
- 3309 Bach Ave
- 3311 Bach Ave
- 3311 Cardiff Ave
- 3307 Cardiff Ave
- 3551 Harrow Ave
- 3680 Brotherton Rd
- 3211 Bach Ave
- 3209 Bach Ave
- 3709 Brotherton Rd
- 3566 Harrow Ave
- 4121 Ballard Ave
- 4154 Sherel Ln
- 4146 Sherel Ln
- 4158 Sherel Ln
- 4149 Pillars Dr
- 4142 Sherel Ln
- 4145 Pillars Dr
- 4153 Pillars Dr
- 4141 Pillars Dr
- 4162 Sherel Ln
- 4157 Pillars Dr
- 4138 Sherel Ln
- 4149 Sherel Ln
- 4145 Sherel Ln
- 4157 Sherel Ln
- 4137 Pillars Dr
- 4141 Sherel Ln
- 4161 Pillars Dr
- 4161 Sherel Ln
- 4166 Sherel Ln
- 4134 Sherel Ln
Your Personal Tour Guide
Ask me questions while you tour the home.