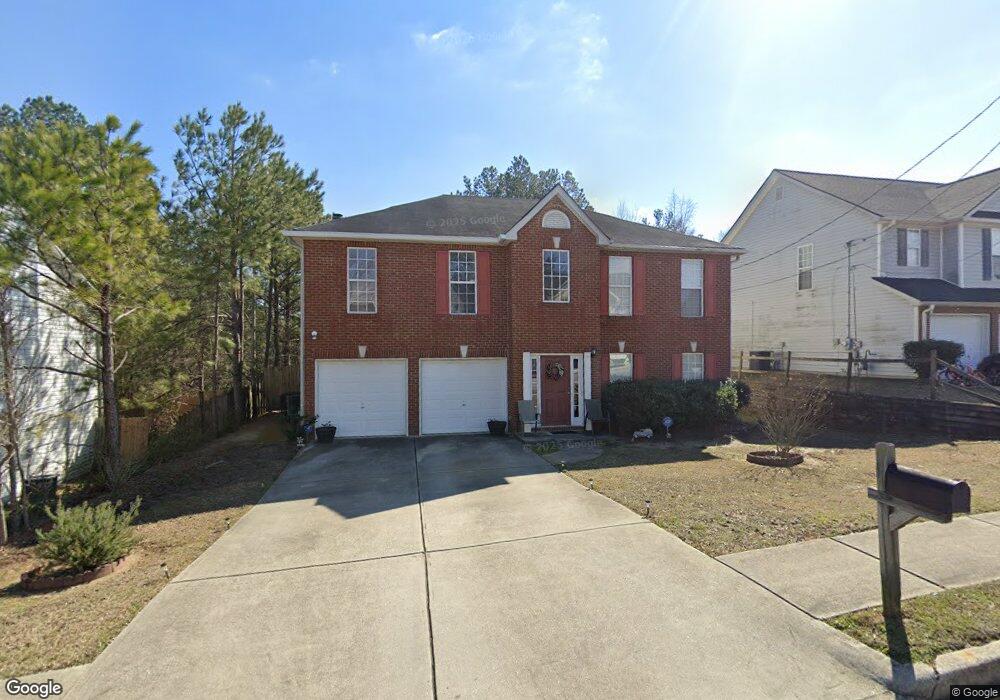
4150 Shining Armor Dr Conley, GA 30288
Estimated Value: $271,000 - $318,000
4
Beds
3
Baths
2,789
Sq Ft
$107/Sq Ft
Est. Value
About This Home
This home is located at 4150 Shining Armor Dr, Conley, GA 30288 and is currently estimated at $297,670, approximately $106 per square foot. 4150 Shining Armor Dr is a home located in Clayton County with nearby schools including Anderson Elementary School, Forest Park Middle School, and Forest Park High School.
Ownership History
Date
Name
Owned For
Owner Type
Purchase Details
Closed on
May 23, 2008
Sold by
Hud-Housing Of Urban Dev
Bought by
Yeboah Cherrie L
Current Estimated Value
Home Financials for this Owner
Home Financials are based on the most recent Mortgage that was taken out on this home.
Original Mortgage
$110,200
Outstanding Balance
$69,094
Interest Rate
5.86%
Mortgage Type
New Conventional
Estimated Equity
$228,576
Purchase Details
Closed on
Aug 7, 2007
Sold by
Everhome Mortgage
Bought by
Hud-Housing Of Urban Dev
Purchase Details
Closed on
Oct 31, 2003
Sold by
First Dimension Homes Inc
Bought by
Boglin Maria M
Home Financials for this Owner
Home Financials are based on the most recent Mortgage that was taken out on this home.
Original Mortgage
$155,272
Interest Rate
6%
Mortgage Type
FHA
Purchase Details
Closed on
Jun 30, 2003
Sold by
Dozier Dev Co Llc
Bought by
First Dimension Homes Inc
Create a Home Valuation Report for This Property
The Home Valuation Report is an in-depth analysis detailing your home's value as well as a comparison with similar homes in the area
Home Values in the Area
Average Home Value in this Area
Purchase History
| Date | Buyer | Sale Price | Title Company |
|---|---|---|---|
| Yeboah Cherrie L | -- | -- | |
| Hud-Housing Of Urban Dev | -- | -- | |
| Everhome Mtg Co | $159,673 | -- | |
| Boglin Maria M | $156,500 | -- | |
| First Dimension Homes Inc | -- | -- |
Source: Public Records
Mortgage History
| Date | Status | Borrower | Loan Amount |
|---|---|---|---|
| Open | Yeboah Cherrie L | $110,200 | |
| Previous Owner | Boglin Maria M | $155,272 |
Source: Public Records
Tax History
| Year | Tax Paid | Tax Assessment Tax Assessment Total Assessment is a certain percentage of the fair market value that is determined by local assessors to be the total taxable value of land and additions on the property. | Land | Improvement |
|---|---|---|---|---|
| 2025 | $4,583 | $128,680 | $8,800 | $119,880 |
| 2024 | $2,894 | $83,200 | $8,800 | $74,400 |
| 2023 | $3,004 | $83,200 | $8,800 | $74,400 |
| 2022 | $2,094 | $91,560 | $8,800 | $82,760 |
| 2021 | $2,108 | $62,400 | $7,200 | $55,200 |
| 2020 | $2,134 | $62,400 | $7,200 | $55,200 |
| 2019 | $2,165 | $69,604 | $7,200 | $62,404 |
| 2018 | $1,792 | $53,200 | $7,200 | $46,000 |
| 2017 | $1,833 | $54,120 | $7,200 | $46,920 |
| 2016 | $1,490 | $45,681 | $7,200 | $38,481 |
| 2015 | $1,109 | $0 | $0 | $0 |
| 2014 | $1,017 | $34,596 | $7,200 | $27,396 |
Source: Public Records
Map
Nearby Homes
- 1608 Enchanted Forest Dr
- 4170 Jewell Terrace
- 1591 Marceau Dr
- 1588 Marceau Dr
- 1521 Valley Green Ct
- 4061 Jewell Terrace
- 4052 Conley Dr
- 1711 Rock Cut Rd
- 1703 Rock Cut Rd Unit 1
- 1625 Conley Rd Unit 275
- 1625 Conley Rd Unit 21
- 1625 Conley Rd Unit 171
- 1625 Conley Rd Unit 229
- 1625 Conley Rd Unit 82
- 1625 Conley Rd Unit 76
- 1625 Conley Rd Unit 277
- 1625 Conley Rd Unit 8
- 1625 Conley Rd Unit 181
- 1600 Keystone Dr
- 1367 Oakview Cir
- 4156 Shining Armor Dr
- 4144 Shining Armor Dr
- 4162 Shining Armor Dr
- 4183 Tressy Ct
- 1766 Marceau Dr
- 4132 Shining Armor Dr Unit 2/27
- 4132 Shining Armor Dr
- 4132 Shining Armor Dr
- 4149 Shining Armor Dr
- 4179 Tressy Ct
- 4155 Shining Armor Dr
- 4143 Shining Armor Dr
- 4168 Shining Armor Dr Unit 2
- 4157 Shining Armor Dr
- 1592 Enchanted Forest Dr
- 4135 Shining Armor Dr
- 1600 Enchanted Forest Dr
- 4124 Jousting Ct
- 1754 Marceau Dr
- 4176 Shining Armor Dr Unit 2
Your Personal Tour Guide
Ask me questions while you tour the home.