4150 Shoals Point Unit 4150 Union City, GA 30291
Estimated Value: $197,339 - $214,000
3
Beds
3
Baths
1,488
Sq Ft
$139/Sq Ft
Est. Value
About This Home
This home is located at 4150 Shoals Point Unit 4150, Union City, GA 30291 and is currently estimated at $207,335, approximately $139 per square foot. 4150 Shoals Point Unit 4150 is a home located in Fulton County with nearby schools including Feldwood Elementary School, Woodland Middle School, and Banneker High School.
Ownership History
Date
Name
Owned For
Owner Type
Purchase Details
Closed on
Jul 19, 2019
Sold by
Henson Yolanda
Bought by
Decency Associates Llc
Current Estimated Value
Purchase Details
Closed on
Jun 20, 2008
Sold by
Fannie Mae
Bought by
Henson Yolanda
Home Financials for this Owner
Home Financials are based on the most recent Mortgage that was taken out on this home.
Original Mortgage
$82,215
Interest Rate
5.96%
Mortgage Type
FHA
Purchase Details
Closed on
Sep 4, 2007
Sold by
Everhome Mortgage
Bought by
Federal National Mortgage Association
Purchase Details
Closed on
Mar 3, 2006
Sold by
Eric Chafin Home Builders Inc
Bought by
Burton Roberta A
Home Financials for this Owner
Home Financials are based on the most recent Mortgage that was taken out on this home.
Original Mortgage
$127,822
Interest Rate
6.19%
Mortgage Type
New Conventional
Create a Home Valuation Report for This Property
The Home Valuation Report is an in-depth analysis detailing your home's value as well as a comparison with similar homes in the area
Home Values in the Area
Average Home Value in this Area
Purchase History
| Date | Buyer | Sale Price | Title Company |
|---|---|---|---|
| Decency Associates Llc | $117,500 | -- | |
| Henson Yolanda | -- | -- | |
| Federal National Mortgage Association | -- | -- | |
| Everhome Mortgage Co | $109,030 | -- | |
| Burton Roberta A | $127,900 | -- |
Source: Public Records
Mortgage History
| Date | Status | Borrower | Loan Amount |
|---|---|---|---|
| Previous Owner | Henson Yolanda | $82,215 | |
| Previous Owner | Burton Roberta A | $127,822 |
Source: Public Records
Tax History Compared to Growth
Tax History
| Year | Tax Paid | Tax Assessment Tax Assessment Total Assessment is a certain percentage of the fair market value that is determined by local assessors to be the total taxable value of land and additions on the property. | Land | Improvement |
|---|---|---|---|---|
| 2025 | $2,858 | $93,360 | $18,600 | $74,760 |
| 2023 | $2,094 | $74,200 | $15,120 | $59,080 |
| 2022 | $2,583 | $65,880 | $9,120 | $56,760 |
| 2021 | $2,088 | $52,160 | $11,520 | $40,640 |
| 2020 | $1,912 | $47,000 | $10,360 | $36,640 |
| 2019 | $372 | $23,120 | $4,480 | $18,640 |
| 2018 | $372 | $22,600 | $4,360 | $18,240 |
| 2017 | $371 | $21,720 | $4,200 | $17,520 |
| 2016 | $370 | $21,720 | $4,200 | $17,520 |
| 2015 | $371 | $21,720 | $4,200 | $17,520 |
| 2014 | $373 | $21,720 | $4,200 | $17,520 |
Source: Public Records
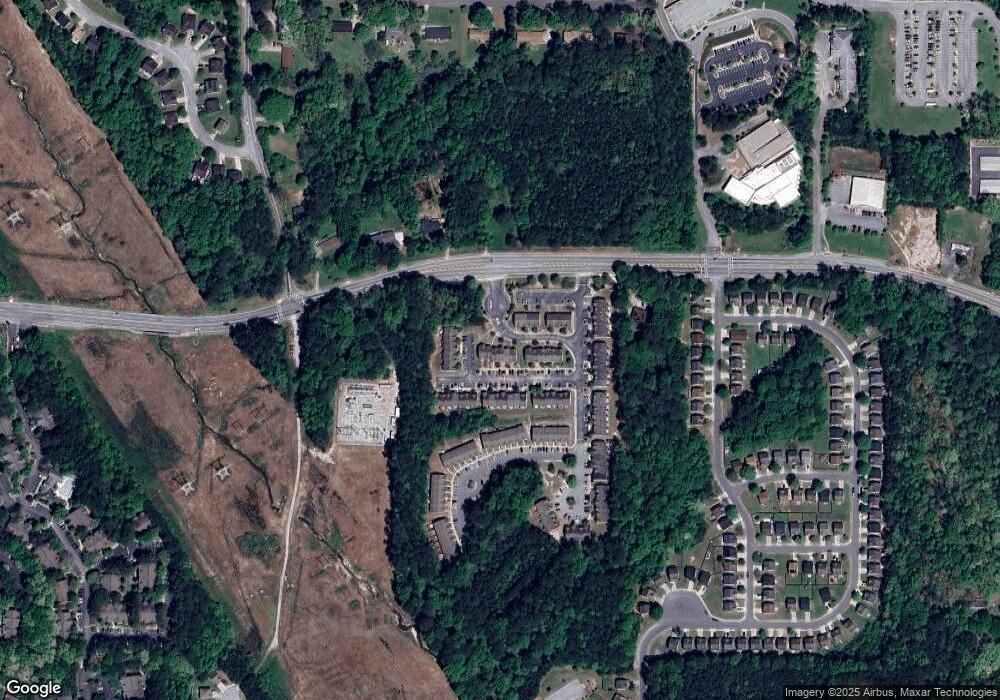
Map
Nearby Homes
- 6226 Flat Trace
- 6226 Flat Trc
- 4176 Flat Trail
- 6240 Shenfield Ln
- 4018 Carisbrook Dr
- 4165 Flat Shoals Rd
- 3827 Shenfield Dr
- 680 Dot Dr
- 590 Dot Dr
- 605 Dot Dr
- 410 Basildon Cove
- 4335 Shaffer Ct
- 4335 Shaffer Ct Unit 41
- 820 Tallulah Ct
- 6302 Mallory Ridge
- 6302 Mallory Ridge Unit 2
- 4352 Shaffer Ct
- 4352 Shaffer Ct Unit 58
- 6152 Oakley Rd
- 6148 Oakley Rd Unit 23
- 4150 Shoals Point
- 4154 Shoals Point
- 4158 Shoals Point
- 4158 Shoals Point Unit 4158
- 4142 Shoals Point Unit 112
- 4138 Shoals Point
- 4130 Shoals Point
- 4147 Shoals Point Unit 1
- 4126 Shoals Point
- 4143 Shoals Point
- 6214 Flat Trace
- 6214 Flat Trace
- 6214 Flat Trace Unit 6214
- 4139 Shoals Point Unit 3
- 4122 Shoals Point
- 6210 Flat Trace Unit 6210
- 6210 Flat Trace
- 6210 Flat Trace
- 6218 Flat Trace Unit 103
- 6206 Flat Trace Unit 6206