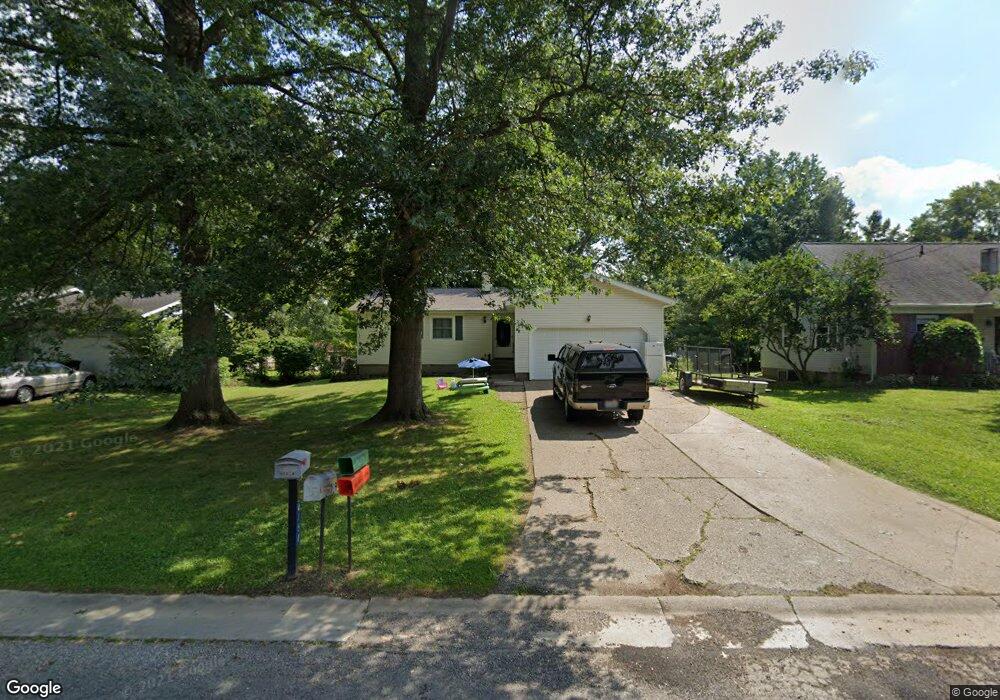
4150 Siefer Dr Rootstown, OH 44272
Estimated Value: $182,584 - $226,000
4
Beds
1
Bath
1,246
Sq Ft
$164/Sq Ft
Est. Value
About This Home
This home is located at 4150 Siefer Dr, Rootstown, OH 44272 and is currently estimated at $204,146, approximately $163 per square foot. 4150 Siefer Dr is a home located in Portage County with nearby schools including Rootstown Middle School - Schnee Building and Rootstown High School.
Ownership History
Date
Name
Owned For
Owner Type
Purchase Details
Closed on
Jun 11, 2021
Sold by
Kelly Dale
Bought by
Woodall Nicholas A and Sampson Samantha L
Current Estimated Value
Home Financials for this Owner
Home Financials are based on the most recent Mortgage that was taken out on this home.
Original Mortgage
$166,822
Outstanding Balance
$151,037
Interest Rate
2.9%
Mortgage Type
FHA
Estimated Equity
$53,109
Purchase Details
Closed on
Dec 22, 2020
Sold by
Vasbinder Steven D and Vasbinder Bridgette L
Bought by
Kelly Dale
Purchase Details
Closed on
Jun 24, 2004
Sold by
Allen Robert J and Allen Bernadette C
Bought by
Vasbinder Steven D and Vasbinder Bridgette L
Home Financials for this Owner
Home Financials are based on the most recent Mortgage that was taken out on this home.
Original Mortgage
$103,000
Interest Rate
6.37%
Mortgage Type
Purchase Money Mortgage
Purchase Details
Closed on
Jun 29, 1988
Bought by
Allen Robert J
Create a Home Valuation Report for This Property
The Home Valuation Report is an in-depth analysis detailing your home's value as well as a comparison with similar homes in the area
Home Values in the Area
Average Home Value in this Area
Purchase History
| Date | Buyer | Sale Price | Title Company |
|---|---|---|---|
| Woodall Nicholas A | -- | None Listed On Document | |
| Kelly Dale | $112,000 | None Available | |
| Vasbinder Steven D | $115,000 | Multiple | |
| Allen Robert J | $63,000 | -- |
Source: Public Records
Mortgage History
| Date | Status | Borrower | Loan Amount |
|---|---|---|---|
| Open | Woodall Nicholas A | $166,822 | |
| Previous Owner | Vasbinder Steven D | $103,000 |
Source: Public Records
Tax History Compared to Growth
Tax History
| Year | Tax Paid | Tax Assessment Tax Assessment Total Assessment is a certain percentage of the fair market value that is determined by local assessors to be the total taxable value of land and additions on the property. | Land | Improvement |
|---|---|---|---|---|
| 2024 | $2,244 | $55,200 | $7,770 | $47,430 |
| 2023 | $1,831 | $39,940 | $7,770 | $32,170 |
| 2022 | $1,805 | $39,940 | $7,770 | $32,170 |
| 2021 | $1,846 | $39,940 | $7,770 | $32,170 |
| 2020 | $1,662 | $35,490 | $7,770 | $27,720 |
| 2019 | $1,669 | $35,490 | $7,770 | $27,720 |
| 2018 | $1,476 | $29,680 | $7,770 | $21,910 |
| 2017 | $1,476 | $29,680 | $7,770 | $21,910 |
| 2016 | $1,442 | $29,680 | $7,770 | $21,910 |
| 2015 | $1,579 | $29,680 | $7,770 | $21,910 |
| 2014 | $1,470 | $29,680 | $7,770 | $21,910 |
| 2013 | $1,722 | $29,680 | $7,770 | $21,910 |
Source: Public Records
Map
Nearby Homes
- 0 Lynn Rd Unit 5110102
- 3987 J A Vaughn Ave
- 4326 Clover Dr
- 0 Rootstown Rd Unit 5173350
- V/L 2 Lynn Rd
- V/L Lynn Rd
- 0 New Milford Rd Unit 11489599
- 0 New Milford Rd Unit 5108183
- 4691 Scenic Dr
- 4770 Valley Hills Dr
- sub lot Lane Ave
- 3807 Industry Rd
- 3637 Old Forge Rd
- 3401 Biltz Rd
- 3021 Hartville Rd
- 3136 Bird Dr
- 5498 Edwards Rd
- 668 Westbrook Ct
- 5387 State Route 14
- 5403 Winding Creek Dr