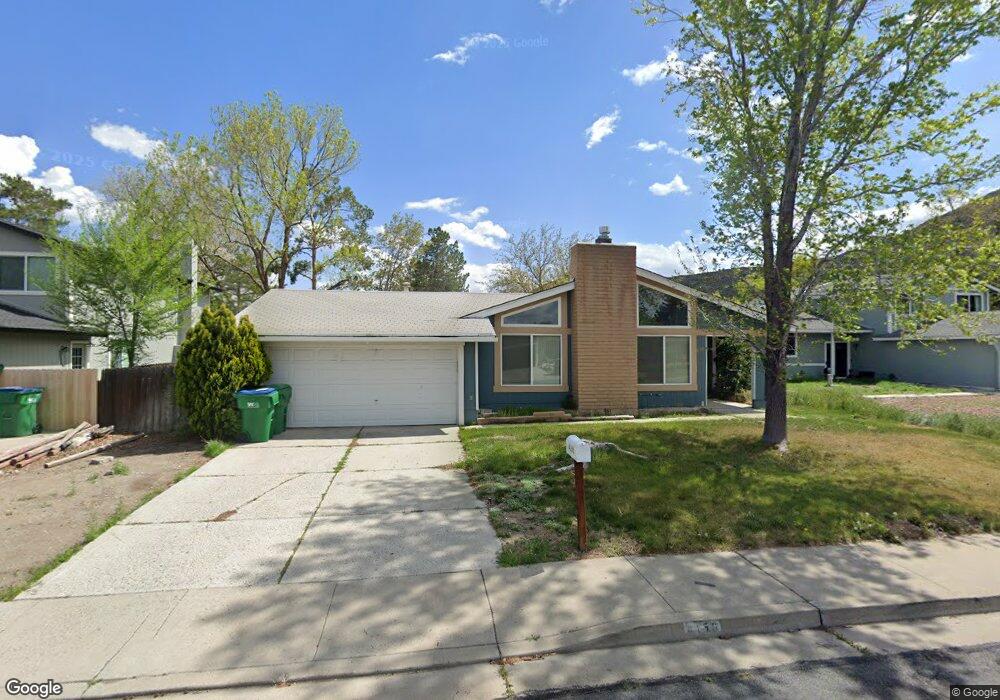
4150 Vivian Ct Unit 3A Reno, NV 89502
Hidden Valley NeighborhoodEstimated Value: $511,664 - $561,000
4
Beds
2
Baths
1,910
Sq Ft
$281/Sq Ft
Est. Value
About This Home
This home is located at 4150 Vivian Ct Unit 3A, Reno, NV 89502 and is currently estimated at $536,666, approximately $280 per square foot. 4150 Vivian Ct Unit 3A is a home located in Washoe County with nearby schools including Donner Springs Elementary School, Edward L Pine Middle School, and Damonte Ranch High School.
Ownership History
Date
Name
Owned For
Owner Type
Purchase Details
Closed on
Sep 1, 2025
Sold by
Filcher Steven L
Bought by
Filcher Family Living Trust and Filcher
Current Estimated Value
Purchase Details
Closed on
Jun 25, 2020
Sold by
Filcher Stevan L and Filcher Natalie J
Bought by
Filcher Steven L
Purchase Details
Closed on
Nov 24, 2010
Sold by
Mchenry Terry W and Mchenry Martheeda L
Bought by
Filcher Steven L and Filcher Natalie J
Home Financials for this Owner
Home Financials are based on the most recent Mortgage that was taken out on this home.
Original Mortgage
$147,907
Interest Rate
4.5%
Mortgage Type
FHA
Purchase Details
Closed on
Apr 4, 2003
Sold by
Mae Vanessen George Jerome and Mae Vanessenn Marcele
Bought by
Mchenry Terry W and Mchenry Martheeda L
Home Financials for this Owner
Home Financials are based on the most recent Mortgage that was taken out on this home.
Original Mortgage
$130,000
Interest Rate
5.78%
Create a Home Valuation Report for This Property
The Home Valuation Report is an in-depth analysis detailing your home's value as well as a comparison with similar homes in the area
Home Values in the Area
Average Home Value in this Area
Purchase History
| Date | Buyer | Sale Price | Title Company |
|---|---|---|---|
| Filcher Family Living Trust | -- | None Listed On Document | |
| Filcher Steven L | -- | None Available | |
| Filcher Steven L | $150,000 | First Centennial Reno | |
| Mchenry Terry W | $195,000 | Western Title Incorporated |
Source: Public Records
Mortgage History
| Date | Status | Borrower | Loan Amount |
|---|---|---|---|
| Previous Owner | Filcher Steven L | $147,907 | |
| Previous Owner | Mchenry Terry W | $130,000 |
Source: Public Records
Tax History Compared to Growth
Tax History
| Year | Tax Paid | Tax Assessment Tax Assessment Total Assessment is a certain percentage of the fair market value that is determined by local assessors to be the total taxable value of land and additions on the property. | Land | Improvement |
|---|---|---|---|---|
| 2025 | $1,707 | $67,846 | $37,135 | $30,711 |
| 2024 | $1,707 | $64,403 | $32,550 | $31,853 |
| 2023 | $1,658 | $65,250 | $34,230 | $31,021 |
| 2022 | $3,663 | $54,946 | $28,420 | $26,526 |
| 2021 | $1,564 | $47,675 | $20,650 | $27,025 |
| 2020 | $2,874 | $48,337 | $20,650 | $27,687 |
| 2019 | $1,472 | $48,061 | $20,965 | $27,096 |
| 2018 | $1,430 | $41,851 | $14,805 | $27,046 |
| 2017 | $1,390 | $41,441 | $13,860 | $27,581 |
| 2016 | $1,355 | $39,936 | $11,340 | $28,596 |
| 2015 | $1,353 | $39,347 | $10,115 | $29,232 |
| 2014 | $1,313 | $37,413 | $8,890 | $28,523 |
| 2013 | -- | $34,671 | $6,300 | $28,371 |
Source: Public Records
Map
Nearby Homes
- 4120 Vivian Ct
- 4071 Snowshoe Ln
- 4550 Noche Ln
- 4066 Snowshoe Ln
- 4318 Leeward Ln
- 4390 Reggie Rd
- 4405 Mesa Grande Ct
- 4491 Creekside Cir
- 4577 Reggie Rd Unit 22
- 4593 Reggie Rd
- 4525 Dos Rios Ct
- 4550 Rio Poco Rd
- 4580 Matich Dr Unit 92
- 4634 Rio Poco Rd Unit 68
- 4604 Rio Poco Rd
- 4769 Reggie Rd Unit 254
- 56 Lucky Ln
- 4777 Reggie Rd Unit 255
- 4465 Boca Way Unit 36
- 4465 Boca Way Unit 22
- 4140 Vivian Ct
- 4160 Vivian Ct
- 4155 Bismarck Dr
- 4145 Bismarck Dr
- 4341 Acadia Way
- 4130 Vivian Ct
- 4141 Vivian Ct
- 4165 Bismarck Dr
- 4151 Vivian Ct
- 4135 Bismarck Dr
- 4175 Bismarck Dr
- 4161 Vivian Ct
- 4131 Vivian Ct
- 4361 Acadia Way
- 4171 Vivian Ct
- 4121 Vivian Ct
- 4365 Lloyd Way
- 4371 Acadia Way
- 4150 Snowshoe Ln
- 4140 Snowshoe Ln