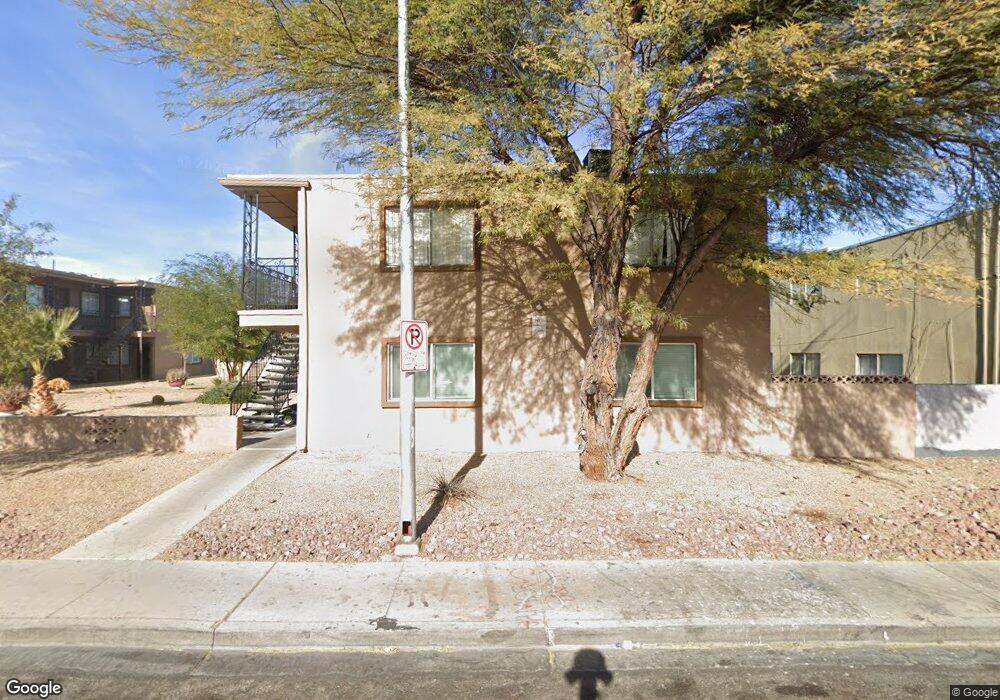
4152 Silver Dollar Ave Unit 3 Las Vegas, NV 89102
Richfield NeighborhoodEstimated Value: $74,000 - $129,000
2
Beds
1
Bath
640
Sq Ft
$167/Sq Ft
Est. Value
About This Home
This home is located at 4152 Silver Dollar Ave Unit 3, Las Vegas, NV 89102 and is currently estimated at $107,052, approximately $167 per square foot. 4152 Silver Dollar Ave Unit 3 is a home located in Clark County with nearby schools including Dr. C Owen Roundy Elementary School, Elaine Wynn Elementary School, and James Cashman Middle School.
Ownership History
Date
Name
Owned For
Owner Type
Purchase Details
Closed on
Feb 29, 2024
Sold by
Palumbo Pasquale
Bought by
Silver Dollar 2016 Llc
Current Estimated Value
Purchase Details
Closed on
Jun 13, 2019
Sold by
Nguyen Qui
Bought by
Palumbo Pasquale
Purchase Details
Closed on
Apr 24, 2019
Sold by
Qui Nguyen Family Trust
Bought by
Nguyen Qui D
Purchase Details
Closed on
Jan 22, 2019
Sold by
Roy Archana
Bought by
Qui Nguyen Family Trust
Purchase Details
Closed on
Oct 6, 2006
Sold by
Whitney Investments Iii Llc
Bought by
Roy Archana
Home Financials for this Owner
Home Financials are based on the most recent Mortgage that was taken out on this home.
Original Mortgage
$58,400
Interest Rate
6.46%
Mortgage Type
Purchase Money Mortgage
Purchase Details
Closed on
Nov 12, 2003
Sold by
World Industries
Bought by
Whitney Investments
Create a Home Valuation Report for This Property
The Home Valuation Report is an in-depth analysis detailing your home's value as well as a comparison with similar homes in the area
Home Values in the Area
Average Home Value in this Area
Purchase History
| Date | Buyer | Sale Price | Title Company |
|---|---|---|---|
| Silver Dollar 2016 Llc | $55,000 | None Listed On Document | |
| Palumbo Pasquale | $55,000 | Equity Title Of Nevada | |
| Nguyen Qui D | -- | None Available | |
| Qui Nguyen Family Trust | $33,100 | Equity Title Of Nevada | |
| Roy Archana | $73,000 | Fidelity National Title | |
| Whitney Investments | $28,000 | -- |
Source: Public Records
Mortgage History
| Date | Status | Borrower | Loan Amount |
|---|---|---|---|
| Previous Owner | Roy Archana | $58,400 |
Source: Public Records
Tax History Compared to Growth
Tax History
| Year | Tax Paid | Tax Assessment Tax Assessment Total Assessment is a certain percentage of the fair market value that is determined by local assessors to be the total taxable value of land and additions on the property. | Land | Improvement |
|---|---|---|---|---|
| 2025 | $486 | $20,441 | $14,000 | $6,441 |
| 2024 | $307 | $20,441 | $14,000 | $6,441 |
| 2023 | $307 | $16,856 | $11,200 | $5,656 |
| 2022 | $302 | $14,207 | $9,100 | $5,107 |
| 2021 | $263 | $14,137 | $9,275 | $4,862 |
| 2020 | $242 | $13,538 | $9,275 | $4,263 |
| 2019 | $239 | $8,346 | $4,200 | $4,146 |
| 2018 | $228 | $8,153 | $4,200 | $3,953 |
| 2017 | $268 | $8,161 | $4,200 | $3,961 |
| 2016 | $356 | $7,898 | $4,200 | $3,698 |
| 2015 | $354 | $6,286 | $2,800 | $3,486 |
| 2014 | $348 | $6,228 | $2,800 | $3,428 |
Source: Public Records
Map
Nearby Homes
- 4248 Tara Ave Unit 2
- 2851 S Valley View Blvd Unit 1025
- 2851 S Valley View Blvd Unit 1098
- 2851 S Valley View Blvd Unit 1120
- 2851 S Valley View Blvd Unit 1021
- 2851 S Valley View Blvd Unit 1153
- 2851 S Valley View Blvd Unit 1104
- 2851 S Valley View Blvd Unit 1044
- 2851 S Valley View Blvd Unit 1199
- 2851 S Valley View Blvd Unit 1060
- 2851 S Valley View Blvd Unit 1130
- 2851 S Valley View Blvd Unit 1039
- 2851 S Valley View Blvd Unit 1134
- 2851 S Valley View Blvd Unit 1071
- 2851 S Valley View Blvd Unit 2148
- 2851 S Valley View Blvd Unit 1132A
- 2851 S Valley View Blvd Unit 1139B
- 2851 S Valley View Blvd Unit 1075
- 4316 Tara Ave Unit 4
- 4009 Danford Place Unit 1
- 4152 Silver Dollar Ave Unit 1
- 4152 Silver Dollar Ave Unit 7
- 4152 Silver Dollar Ave Unit 6
- 4152 Silver Dollar Ave Unit 5
- 4152 Silver Dollar Ave Unit 8
- 4152 Silver Dollar Ave Unit 4
- 4152 Silver Dollar Ave Unit 2
- 4136 Silver Dollar Ave
- 4168 Silver Dollar Ave Unit 8
- 4168 Silver Dollar Ave Unit 2
- 4168 Silver Dollar Ave Unit 1
- 4168 Silver Dollar Ave Unit 5
- 4168 Silver Dollar Ave Unit 7
- 4168 Silver Dollar Ave Unit 6
- 4168 Silver Dollar Ave Unit 4
- 4168 Silver Dollar Ave Unit 3
- 4186 Silver Dollar Ave Unit 8
- 4186 Silver Dollar Ave Unit 2
- 4186 Silver Dollar Ave Unit 4
- 4186 Silver Dollar Ave Unit 1