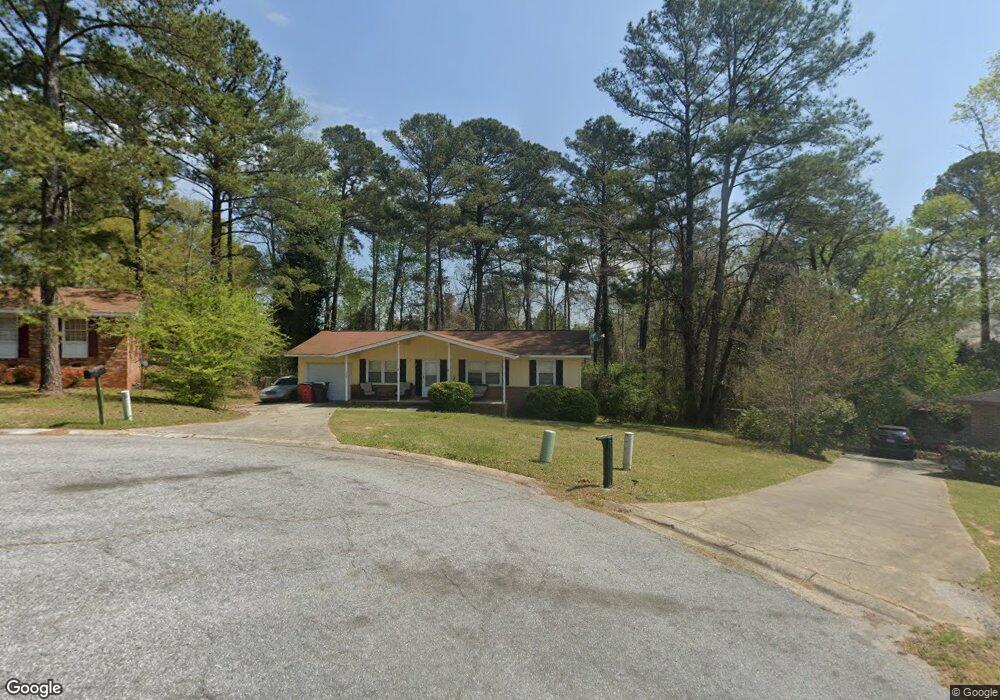
4152 W Hickory Ct Macon, GA 31210
Estimated Value: $101,000 - $116,000
3
Beds
2
Baths
960
Sq Ft
$112/Sq Ft
Est. Value
About This Home
This home is located at 4152 W Hickory Ct, Macon, GA 31210 and is currently estimated at $108,000, approximately $112 per square foot. 4152 W Hickory Ct is a home located in Bibb County with nearby schools including Union Elementary School, Weaver Middle School, and Westside High School.
Ownership History
Date
Name
Owned For
Owner Type
Purchase Details
Closed on
Jul 15, 2020
Sold by
Broadview Sfga Acquisitions Llc
Bought by
Sfga 2020 Llc
Current Estimated Value
Home Financials for this Owner
Home Financials are based on the most recent Mortgage that was taken out on this home.
Original Mortgage
$1,622,500
Outstanding Balance
$835,374
Interest Rate
3.2%
Mortgage Type
Commercial
Estimated Equity
-$727,374
Purchase Details
Closed on
Feb 28, 2019
Sold by
Strickland Rick and Strickland James R
Bought by
Broadview Sfga Acquisitions Llc
Purchase Details
Closed on
Oct 28, 2008
Sold by
Nationstar Mortgage Llc
Bought by
Strickland Rick
Purchase Details
Closed on
Jun 3, 2008
Sold by
Stubbs Vicki
Bought by
Nationstar Mortgage Llc
Purchase Details
Closed on
Nov 20, 2003
Bought by
Stubbs Vicki
Purchase Details
Closed on
Jun 25, 2001
Create a Home Valuation Report for This Property
The Home Valuation Report is an in-depth analysis detailing your home's value as well as a comparison with similar homes in the area
Home Values in the Area
Average Home Value in this Area
Purchase History
| Date | Buyer | Sale Price | Title Company |
|---|---|---|---|
| Sfga 2020 Llc | -- | Os National Llc | |
| Broadview Sfga Acquisitions Llc | $54,000 | None Available | |
| Strickland Rick | $39,000 | None Available | |
| Nationstar Mortgage Llc | $30,600 | -- | |
| Nationstar Mortgage Llc | $30,550 | None Available | |
| Stubbs Vicki | $82,500 | -- | |
| -- | $67,500 | -- |
Source: Public Records
Mortgage History
| Date | Status | Borrower | Loan Amount |
|---|---|---|---|
| Open | Sfga 2020 Llc | $1,622,500 |
Source: Public Records
Tax History Compared to Growth
Tax History
| Year | Tax Paid | Tax Assessment Tax Assessment Total Assessment is a certain percentage of the fair market value that is determined by local assessors to be the total taxable value of land and additions on the property. | Land | Improvement |
|---|---|---|---|---|
| 2025 | $854 | $34,744 | $3,782 | $30,962 |
| 2024 | $834 | $32,838 | $3,782 | $29,056 |
| 2023 | $682 | $26,842 | $3,025 | $23,817 |
| 2022 | $851 | $24,575 | $4,357 | $20,218 |
| 2021 | $628 | $16,516 | $2,075 | $14,441 |
| 2020 | $641 | $16,516 | $2,075 | $14,441 |
| 2019 | $609 | $15,553 | $2,075 | $13,478 |
| 2018 | $1,117 | $15,628 | $2,075 | $13,553 |
| 2017 | $586 | $15,628 | $2,075 | $13,553 |
| 2016 | $541 | $15,628 | $2,075 | $13,553 |
| 2015 | $783 | $15,991 | $2,075 | $13,916 |
| 2014 | $1,146 | $20,348 | $6,432 | $13,916 |
Source: Public Records
Map
Nearby Homes
- 4142 W Hickory Ct
- 4162 W Hickory Ct
- 4124 Elizabeth Ct
- 4132 W Hickory Ct
- 4151 W Hickory Ct
- 4120 Elizabeth Ct
- 4141 W Hickory Ct
- 4122 W Hickory Ct
- 4112 Elizabeth Ct
- 4780 Two Oak Dr
- 4133 Elizabeth Ct
- 4027 Shirley Ct
- 4136 W Oak Dr
- 4128 W Oak Dr
- 4127 Elizabeth Ct
- 4119 Elizabeth Ct
- 4118 W Oak Dr
- 4102 W Hickory Ct
- 4146 W Oak Dr
- 4019 Shirley Ct