Estimated Value: $283,000 - $323,000
2
Beds
1
Bath
768
Sq Ft
$391/Sq Ft
Est. Value
About This Home
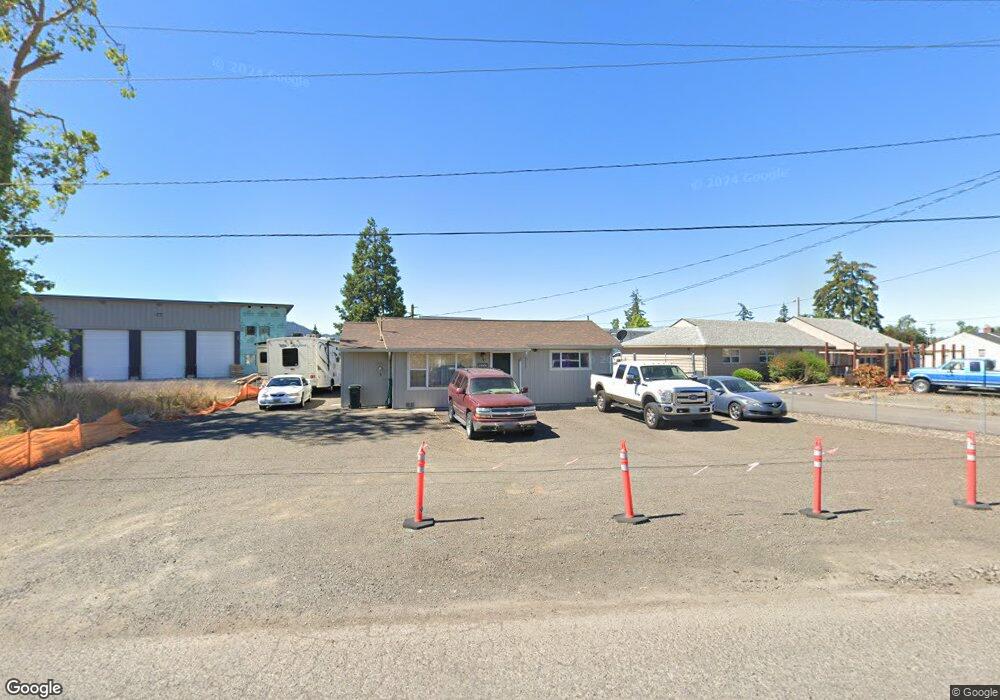
This home is located at 4153 E St, Springfield, OR 97478 and is currently estimated at $299,918, approximately $390 per square foot. 4153 E St is a home located in Lane County with nearby schools including Riverbend Elementary School, Briggs Middle School, and Thurston High School.
Ownership History
Date
Name
Owned For
Owner Type
Purchase Details
Closed on
Mar 7, 2008
Sold by
Lantz Tim
Bought by
T L Lantz Llc
Current Estimated Value
Purchase Details
Closed on
Dec 3, 2002
Sold by
Washington Mutual Bank Fa
Bought by
Va
Purchase Details
Closed on
Jul 31, 2000
Sold by
Edward Munkres Elvin
Bought by
Barrington Larry R
Home Financials for this Owner
Home Financials are based on the most recent Mortgage that was taken out on this home.
Original Mortgage
$78,540
Interest Rate
8.2%
Mortgage Type
VA
Create a Home Valuation Report for This Property
The Home Valuation Report is an in-depth analysis detailing your home's value as well as a comparison with similar homes in the area
Home Values in the Area
Average Home Value in this Area
Purchase History
| Date | Buyer | Sale Price | Title Company |
|---|---|---|---|
| T L Lantz Llc | -- | None Available | |
| Va | $97,682 | Western Pioneer Title Co | |
| Washington Mutual Bank | $97,682 | Western Pioneer Title Co | |
| Barrington Larry R | $77,000 | Evergreen Land Title Co |
Source: Public Records
Mortgage History
| Date | Status | Borrower | Loan Amount |
|---|---|---|---|
| Previous Owner | Barrington Larry R | $78,540 |
Source: Public Records
Tax History
| Year | Tax Paid | Tax Assessment Tax Assessment Total Assessment is a certain percentage of the fair market value that is determined by local assessors to be the total taxable value of land and additions on the property. | Land | Improvement |
|---|---|---|---|---|
| 2025 | $2,057 | $112,157 | -- | -- |
| 2024 | $2,023 | $108,891 | -- | -- |
| 2023 | $2,023 | $105,720 | $0 | $0 |
| 2022 | $1,874 | $102,641 | $0 | $0 |
| 2021 | $1,840 | $99,652 | $0 | $0 |
| 2020 | $1,787 | $96,750 | $0 | $0 |
| 2019 | $1,733 | $93,933 | $0 | $0 |
| 2018 | $1,634 | $88,542 | $0 | $0 |
| 2017 | $1,571 | $88,542 | $0 | $0 |
| 2016 | $1,538 | $85,963 | $0 | $0 |
| 2015 | $1,494 | $83,459 | $0 | $0 |
| 2014 | $1,471 | $81,028 | $0 | $0 |
Source: Public Records
Map
Nearby Homes