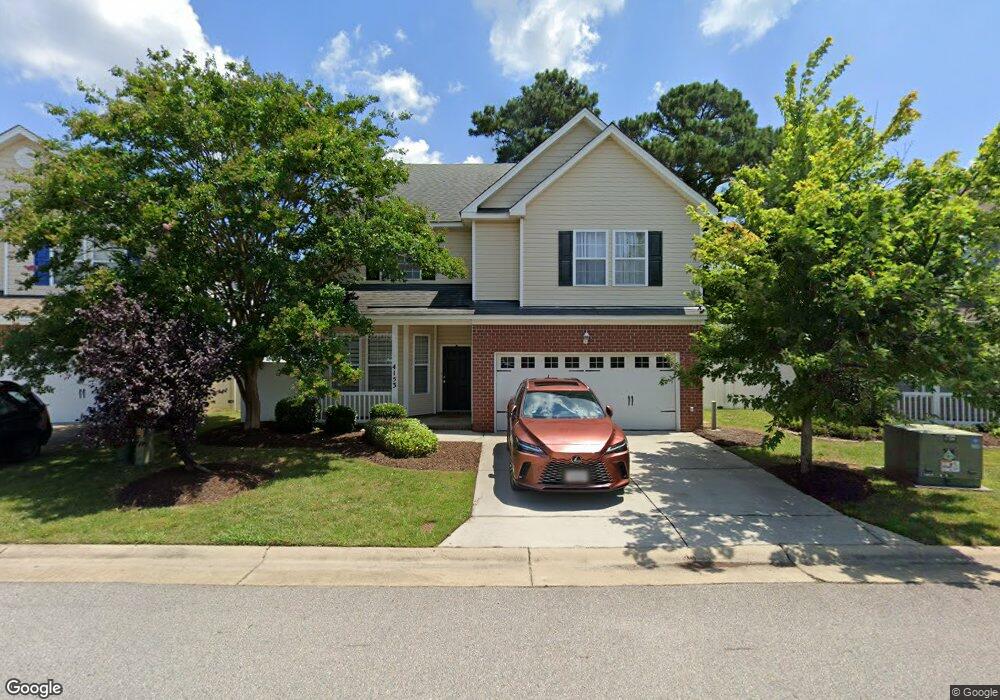
4153 Taughtline Loop Unit 5 Chesapeake, VA 23321
Western Branch NeighborhoodEstimated Value: $378,000 - $400,000
5
Beds
4
Baths
2,464
Sq Ft
$159/Sq Ft
Est. Value
About This Home
This home is located at 4153 Taughtline Loop Unit 5, Chesapeake, VA 23321 and is currently estimated at $390,747, approximately $158 per square foot. 4153 Taughtline Loop Unit 5 is a home located in Chesapeake City with nearby schools including Southwestern Elementary School, Jolliff Middle School, and Western Branch High School.
Ownership History
Date
Name
Owned For
Owner Type
Purchase Details
Closed on
Apr 19, 2022
Sold by
Nance Jason A and Nance Diane E
Bought by
Juma Laviola
Current Estimated Value
Home Financials for this Owner
Home Financials are based on the most recent Mortgage that was taken out on this home.
Original Mortgage
$323,000
Outstanding Balance
$299,902
Interest Rate
3.85%
Mortgage Type
New Conventional
Estimated Equity
$90,846
Purchase Details
Closed on
Nov 14, 2016
Sold by
Walls Derrick C
Bought by
Nance Jason A and Nance Diane E
Home Financials for this Owner
Home Financials are based on the most recent Mortgage that was taken out on this home.
Original Mortgage
$251,289
Interest Rate
3.47%
Mortgage Type
VA
Purchase Details
Closed on
Mar 26, 2015
Sold by
Torres Samyasen
Bought by
Walls Derrick C
Home Financials for this Owner
Home Financials are based on the most recent Mortgage that was taken out on this home.
Original Mortgage
$203,501
Interest Rate
3.77%
Mortgage Type
VA
Purchase Details
Closed on
Apr 27, 2012
Sold by
Towne Park Building Llc
Bought by
Torres Samyasen
Home Financials for this Owner
Home Financials are based on the most recent Mortgage that was taken out on this home.
Original Mortgage
$257,515
Interest Rate
4.08%
Mortgage Type
VA
Create a Home Valuation Report for This Property
The Home Valuation Report is an in-depth analysis detailing your home's value as well as a comparison with similar homes in the area
Home Values in the Area
Average Home Value in this Area
Purchase History
| Date | Buyer | Sale Price | Title Company |
|---|---|---|---|
| Juma Laviola | $345,000 | Old Republic National Title | |
| Nance Jason A | $246,000 | Priority Title & Escrow Llc | |
| Walls Derrick C | $197,000 | -- | |
| Torres Samyasen | $252,095 | -- |
Source: Public Records
Mortgage History
| Date | Status | Borrower | Loan Amount |
|---|---|---|---|
| Open | Juma Laviola | $323,000 | |
| Previous Owner | Nance Jason A | $251,289 | |
| Previous Owner | Walls Derrick C | $203,501 | |
| Previous Owner | Torres Samyasen | $257,515 |
Source: Public Records
Tax History
| Year | Tax Paid | Tax Assessment Tax Assessment Total Assessment is a certain percentage of the fair market value that is determined by local assessors to be the total taxable value of land and additions on the property. | Land | Improvement |
|---|---|---|---|---|
| 2025 | $3,456 | $377,700 | $100,000 | $277,700 |
| 2024 | $3,456 | $342,200 | $95,000 | $247,200 |
| 2023 | $3,043 | $332,400 | $85,000 | $247,400 |
| 2022 | $3,031 | $300,100 | $75,000 | $225,100 |
| 2021 | $2,754 | $262,300 | $65,000 | $197,300 |
| 2020 | $2,644 | $251,800 | $60,000 | $191,800 |
| 2019 | $2,608 | $248,400 | $60,000 | $188,400 |
| 2018 | $2,608 | $236,200 | $55,000 | $181,200 |
| 2017 | $2,533 | $241,200 | $60,000 | $181,200 |
| 2016 | $2,533 | $241,200 | $60,000 | $181,200 |
| 2015 | $2,442 | $232,600 | $55,000 | $177,600 |
| 2014 | $2,480 | $236,200 | $55,000 | $181,200 |
Source: Public Records
Map
Nearby Homes
- 4304 Center Mast Crest
- 3980 Port Rd
- 4008 Sloop Trail
- 3860 Schooner Trail
- 3912 Holly Cove Dr
- 3924 Port Rd
- 3931 Port Rd
- 3861 Ahoy Dr
- 3932 Pierce Ln
- .2ac Airline Blvd
- 4004 River Breeze Cir
- 4126 River Breeze Cir
- 3917 Rex Cir
- 3943 Rex Cir
- 4301 Airline Blvd
- 3709 Bosun Dr
- 305 Bobby Jones Dr
- 1908 Rosemary Ln
- 1821 Spar St
- 102 Ben Hogan Dr
- 4153 Taughtline Loop
- 4157 Taughtline Loop
- 4149 Taughtline Loop Unit 4
- 4149 Taughtline Loop
- 4211 Schooner Trail
- 4145 Taughtline Loop Unit 3
- 4145 Taughtline Loop
- 4213 Schooner Trail
- 4161 Taughtline Loop
- 4217 Schooner Trail
- 4152 Taughtline Loop
- 4209 Schooner Trail
- 4166 Taughtline Loop
- 4165 Taught Line Loop Unit 8
- 4221 Schooner Trail
- 4165 Taughtline Loop
- 4165 Taughtline Loop Unit 8
- 4305 Mast Head Way Unit 2
- 4305 Masthead Way Unit 2
- 4205 Schooner Trail
Your Personal Tour Guide
Ask me questions while you tour the home.