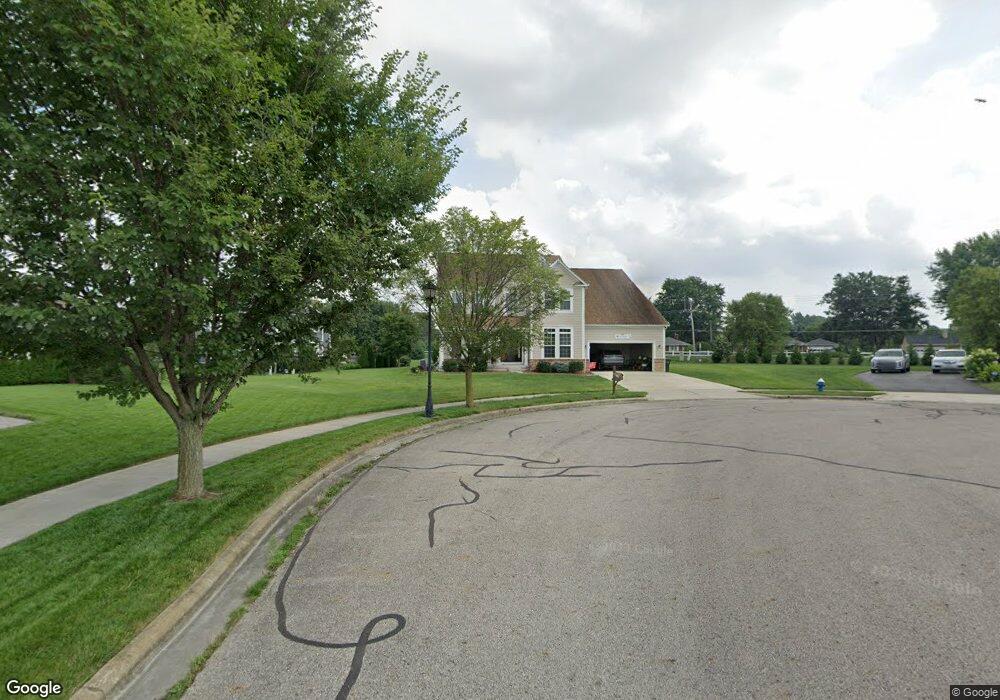
4154 Ivy Crest Ct Hilliard, OH 43026
Estimated Value: $563,000 - $691,000
4
Beds
3
Baths
3,118
Sq Ft
$206/Sq Ft
Est. Value
About This Home
This home is located at 4154 Ivy Crest Ct, Hilliard, OH 43026 and is currently estimated at $641,146, approximately $205 per square foot. 4154 Ivy Crest Ct is a home located in Franklin County with nearby schools including Hoffman Trails Elementary School, Hilliard Station Sixth Grade Elementary School, and Hilliard Heritage Middle School.
Ownership History
Date
Name
Owned For
Owner Type
Purchase Details
Closed on
Sep 13, 2016
Sold by
Jasvir Gill
Bought by
Singh Takhar and Singh Amarjit
Current Estimated Value
Home Financials for this Owner
Home Financials are based on the most recent Mortgage that was taken out on this home.
Original Mortgage
$243,750
Outstanding Balance
$194,233
Interest Rate
3.44%
Estimated Equity
$446,913
Purchase Details
Closed on
Jun 16, 2016
Sold by
Gill Jasvir
Bought by
Takhar Amarjit Singh and Singh Amarjit
Purchase Details
Closed on
Mar 9, 2013
Sold by
Gill Jasvir and Singh Amarjit
Bought by
Kaur Manjinder and Sangha Harpal
Purchase Details
Closed on
Mar 31, 2010
Sold by
Rockford Homes Inc
Bought by
Gill Jasvir and Sing Amarjit
Home Financials for this Owner
Home Financials are based on the most recent Mortgage that was taken out on this home.
Original Mortgage
$347,221
Interest Rate
5.5%
Mortgage Type
FHA
Create a Home Valuation Report for This Property
The Home Valuation Report is an in-depth analysis detailing your home's value as well as a comparison with similar homes in the area
Home Values in the Area
Average Home Value in this Area
Purchase History
| Date | Buyer | Sale Price | Title Company |
|---|---|---|---|
| Singh Takhar | -- | -- | |
| Takhar Amarjit Singh | $152,000 | Fidelity Lawyers Title Agenc | |
| Kaur Manjinder | -- | None Available | |
| Gill Jasvir | $361,800 | Attorney |
Source: Public Records
Mortgage History
| Date | Status | Borrower | Loan Amount |
|---|---|---|---|
| Open | Singh Takhar | $243,750 | |
| Closed | Singh Takhar | -- | |
| Previous Owner | Gill Jasvir | $347,221 |
Source: Public Records
Tax History Compared to Growth
Tax History
| Year | Tax Paid | Tax Assessment Tax Assessment Total Assessment is a certain percentage of the fair market value that is determined by local assessors to be the total taxable value of land and additions on the property. | Land | Improvement |
|---|---|---|---|---|
| 2024 | $33,864 | $197,580 | $49,630 | $147,950 |
| 2023 | $11,370 | $197,575 | $49,630 | $147,945 |
| 2022 | $16,820 | $157,400 | $36,230 | $121,170 |
| 2021 | $11,208 | $157,400 | $36,230 | $121,170 |
| 2020 | $11,183 | $157,400 | $36,230 | $121,170 |
| 2019 | $11,370 | $135,730 | $31,500 | $104,230 |
| 2018 | $11,215 | $135,730 | $31,500 | $104,230 |
| 2017 | $11,193 | $135,730 | $31,500 | $104,230 |
| 2016 | $11,477 | $132,860 | $30,660 | $102,200 |
| 2015 | $11,135 | $132,860 | $30,660 | $102,200 |
| 2014 | $10,858 | $132,860 | $30,660 | $102,200 |
| 2013 | $5,272 | $126,525 | $29,190 | $97,335 |
Source: Public Records
Map
Nearby Homes
- 6504 Shadewater Dr
- 4180 Elliott Rd
- 6228 Parkmeadow Ln
- 4509 Nonius Dr
- 6952 Corsican Loop N
- 6950 Corsican Loop N
- 6954 Corsican Loop N
- 6956 Corsican Loop N
- 6958 Corsican Loop N
- 6960 Corsican Loop N
- 4543 Corsican Loop E
- 4549 Corsican Loop E
- 4547 Corsican Loop E
- 4505 Nonius Dr
- 4545 Corsican Loop E
- Charleston Plan at Hill Farm - Retreat
- Riverside Plan at Hill Farm - Premier
- Augusta Plan at Hill Farm - Retreat
- Durham Plan at Hill Farm - Retreat
- Grandview Plan at Hill Farm - Premier
- 4151 Glynwater Ln
- 4155 Ivy Crest Ct
- 4163 Glynwater Ln
- 4176 Ivy Crest Ct
- 4175 Glynwater Ln
- 6666 Scioto Darby Creek Rd
- 6666 Scioto Darby Rd
- 4188 Ivy Crest Ct
- 4167 Summit Bend Rd
- 6649 Scioto Darby Rd
- 6655 Scioto Darby Rd
- 6655 Sci Darby Creek Rd
- 4189 Glynwater Ln
- 4150 Glynwater Ln
- 6643 Scioto Darby Rd
- 6661 Scioto Darby Rd
- 4173 Summit Bend Rd
- 6676 Scioto Darby Rd
- 4196 Ivy Crest Ct
- 4162 Glynwater Ln