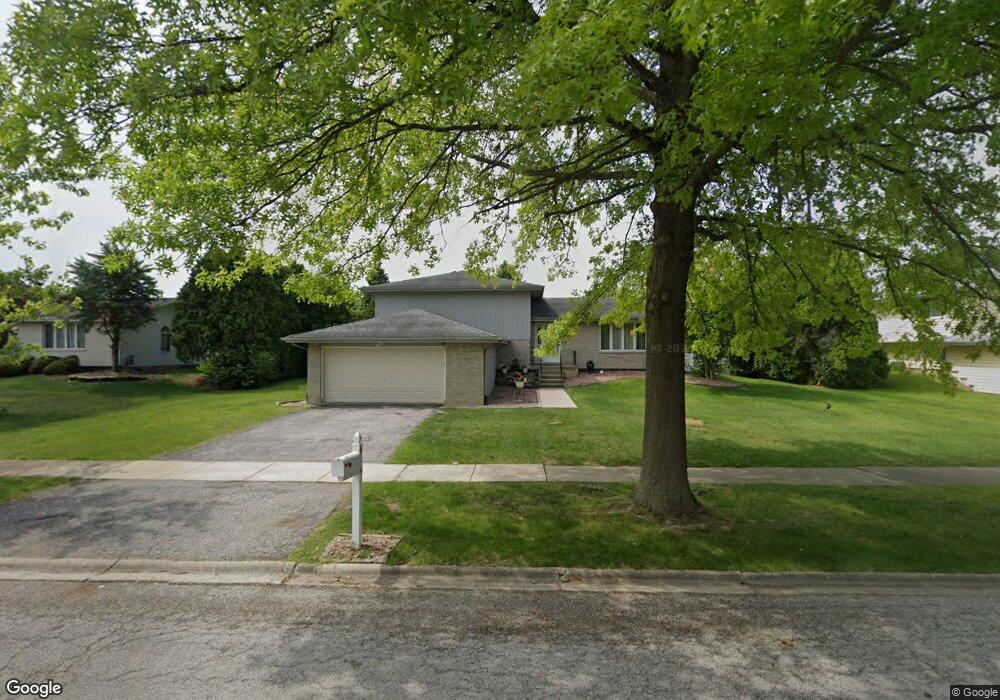
4159 Charleston Rd Matteson, IL 60443
Old Matteson NeighborhoodEstimated Value: $235,000 - $289,000
4
Beds
3
Baths
1,419
Sq Ft
$187/Sq Ft
Est. Value
About This Home
This home is located at 4159 Charleston Rd, Matteson, IL 60443 and is currently estimated at $264,818, approximately $186 per square foot. 4159 Charleston Rd is a home located in Cook County with nearby schools including Illinois School, Matteson Elementary School, and Sauk Elementary School.
Ownership History
Date
Name
Owned For
Owner Type
Purchase Details
Closed on
Nov 16, 2017
Sold by
Thomas Angelika E
Bought by
Garza Noah and Jones Yakeeda
Current Estimated Value
Home Financials for this Owner
Home Financials are based on the most recent Mortgage that was taken out on this home.
Original Mortgage
$189,504
Outstanding Balance
$159,348
Interest Rate
4.25%
Mortgage Type
FHA
Estimated Equity
$105,470
Purchase Details
Closed on
Aug 5, 2003
Sold by
Thomas Stanley B
Bought by
Thomas Angelika E
Purchase Details
Closed on
Jan 18, 1996
Sold by
Melone Louis A and Lauer Susan F
Bought by
Thomas Stanley B and Thomas Angelika E
Home Financials for this Owner
Home Financials are based on the most recent Mortgage that was taken out on this home.
Original Mortgage
$120,000
Interest Rate
7.28%
Create a Home Valuation Report for This Property
The Home Valuation Report is an in-depth analysis detailing your home's value as well as a comparison with similar homes in the area
Home Values in the Area
Average Home Value in this Area
Purchase History
| Date | Buyer | Sale Price | Title Company |
|---|---|---|---|
| Garza Noah | $193,000 | Near North National Title | |
| Thomas Angelika E | -- | -- | |
| Thomas Stanley B | $150,000 | -- |
Source: Public Records
Mortgage History
| Date | Status | Borrower | Loan Amount |
|---|---|---|---|
| Open | Garza Noah | $189,504 | |
| Previous Owner | Thomas Stanley B | $120,000 |
Source: Public Records
Tax History
| Year | Tax Paid | Tax Assessment Tax Assessment Total Assessment is a certain percentage of the fair market value that is determined by local assessors to be the total taxable value of land and additions on the property. | Land | Improvement |
|---|---|---|---|---|
| 2025 | $7,938 | $21,485 | $5,720 | $15,765 |
| 2024 | $7,938 | $21,485 | $5,720 | $15,765 |
| 2023 | $5,864 | $22,521 | $5,720 | $16,801 |
| 2022 | $5,864 | $14,230 | $5,005 | $9,225 |
| 2021 | $5,994 | $14,229 | $5,005 | $9,224 |
| 2020 | $6,592 | $16,045 | $5,005 | $11,040 |
| 2019 | $5,103 | $13,289 | $4,647 | $8,642 |
| 2018 | $5,099 | $13,289 | $4,647 | $8,642 |
| 2017 | $5,158 | $13,757 | $4,647 | $9,110 |
| 2016 | $5,225 | $13,123 | $4,290 | $8,833 |
| 2015 | $5,118 | $13,123 | $4,290 | $8,833 |
| 2014 | $4,984 | $13,123 | $4,290 | $8,833 |
| 2013 | $6,076 | $16,706 | $4,290 | $12,416 |
Source: Public Records
Map
Nearby Homes
- 21616 Richmond Rd
- 4022 Richmond Ct
- 21406 S Jean Ave
- 3919 214th St
- 21308 Tower Ave
- 4430 Maple Ave
- 4448 Maple Ave
- 3727 214th Place Unit 2
- 3704 215th St Unit 205
- 4459 Balmoral Dr
- 22048 Jordan Ln
- 3624 216th St
- 4443 Ascot Ct
- 22100 Karlov Ave
- 4423 Camden Ct
- 3615 214th St
- 4210 Birchwood Rd
- 4201 Birchwood Rd
- 22121 Karlov Ave
- 5085 Euclid Ln
- 4149 Charleston Rd
- 4158 216th St
- 4205 Charleston Rd
- 4146 216th St
- 4139 Charleston Rd
- 4160 Charleston Rd
- 4204 Charleston Rd
- 4138 216th St
- 4211 Sumter Dr
- 4213 216th St
- 4212 Charleston Rd
- 4136 Charleston Rd Unit 3W
- 4136 Charleston Rd Unit 2E
- 4136 Charleston Rd
- 4136 Charleston Rd Unit 2W
- 4215 216th St
- 4159 216th St
- 4127 Charleston Rd
- 4221 216th St
- 4128 216th St
Your Personal Tour Guide
Ask me questions while you tour the home.