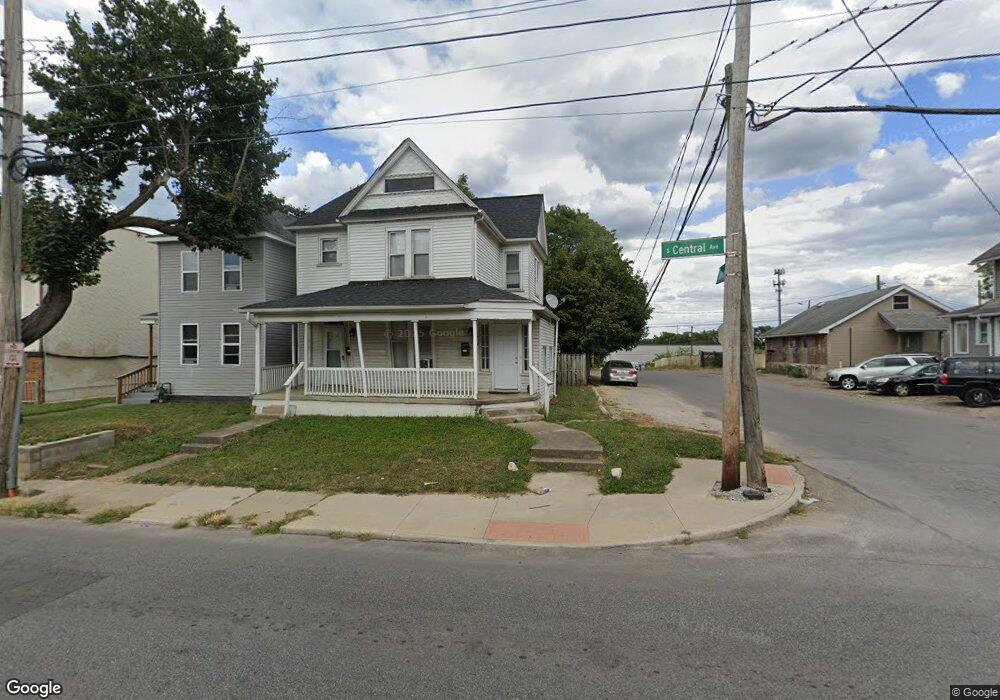
416-418 S Central Ave Columbus, OH 43223
Franklinton NeighborhoodEstimated Value: $210,000 - $234,769
2
Beds
2
Baths
1,632
Sq Ft
$136/Sq Ft
Est. Value
About This Home
This home is located at 416-418 S Central Ave, Columbus, OH 43223 and is currently estimated at $221,442, approximately $135 per square foot. 416-418 S Central Ave is a home located in Franklin County with nearby schools including Starling PK-8, West High School, and Central Point Preparatory Academy.
Ownership History
Date
Name
Owned For
Owner Type
Purchase Details
Closed on
Sep 16, 2024
Sold by
Courtney Brian W
Bought by
B & Kc Properties Llc
Current Estimated Value
Purchase Details
Closed on
Nov 16, 2016
Sold by
B Kc Properties Llc
Bought by
Courtney Ii Brian W
Purchase Details
Closed on
Aug 12, 2014
Sold by
Milligan George E
Bought by
B&Kc Properties Llc
Purchase Details
Closed on
May 25, 2004
Sold by
Staley Deborah
Bought by
Milligan George E
Purchase Details
Closed on
Sep 3, 2002
Sold by
Milligan Patrick E and Milligan Sharon D
Bought by
Milligan George E and Staley Deborah
Purchase Details
Closed on
Aug 11, 1994
Sold by
M Rieser & Assoc Inc
Bought by
Milligan Patrick E
Purchase Details
Closed on
May 29, 1990
Purchase Details
Closed on
Jan 1, 1986
Create a Home Valuation Report for This Property
The Home Valuation Report is an in-depth analysis detailing your home's value as well as a comparison with similar homes in the area
Home Values in the Area
Average Home Value in this Area
Purchase History
| Date | Buyer | Sale Price | Title Company |
|---|---|---|---|
| B & Kc Properties Llc | -- | Superior Title & Escrow | |
| Courtney Ii Brian W | -- | None Available | |
| B&Kc Properties Llc | $21,000 | None Available | |
| Milligan George E | $20,000 | -- | |
| Milligan George E | -- | -- | |
| Milligan Patrick E | $29,000 | -- | |
| -- | $30,000 | -- | |
| -- | $17,000 | -- |
Source: Public Records
Tax History Compared to Growth
Tax History
| Year | Tax Paid | Tax Assessment Tax Assessment Total Assessment is a certain percentage of the fair market value that is determined by local assessors to be the total taxable value of land and additions on the property. | Land | Improvement |
|---|---|---|---|---|
| 2024 | $2,969 | $64,790 | $6,720 | $58,070 |
| 2023 | $2,932 | $64,785 | $6,720 | $58,065 |
| 2022 | $1,025 | $19,290 | $1,540 | $17,750 |
| 2021 | $1,027 | $19,290 | $1,540 | $17,750 |
| 2020 | $1,028 | $19,290 | $1,540 | $17,750 |
| 2019 | $997 | $16,030 | $1,260 | $14,770 |
| 2018 | $498 | $16,030 | $1,260 | $14,770 |
| 2017 | $997 | $16,030 | $1,260 | $14,770 |
| 2016 | $966 | $14,220 | $1,580 | $12,640 |
| 2015 | $440 | $14,220 | $1,580 | $12,640 |
| 2014 | $882 | $14,220 | $1,580 | $12,640 |
| 2013 | $483 | $15,785 | $1,750 | $14,035 |
Source: Public Records
Map
Nearby Homes
- 373 Dana Ave
- 309 Dana Ave
- 277 S Central Ave
- 415 Nace Ave
- 243 S Central Ave
- 293 W Park Ave Unit 295
- 255 S Princeton Ave
- 303 S Yale Ave
- 384-386 S Yale Ave
- 205 S Princeton Ave
- 202 - 204 S Princeton
- 173 Brehl Ave
- 1082 Thomas Ave
- 143 S Princeton Ave
- 144 S Princeton Ave
- 117 Dana Ave
- 148 W Park Ave
- 1340-1342 W State St
- 1719 Sullivant Ave
- 351 Dakota Ave
- 416 S Central Ave Unit 418
- 410 S Central Ave
- 398 S Central Ave Unit 4
- 398 S Central Ave
- 426 S Central Ave
- 400 S Central Ave
- 430 S Central Ave
- 434 S Central Ave
- 409 Brehl Ave
- 409-415 Brehl Ave
- 390 S Central Ave
- 1387 Union
- 401-407 Brehl Ave
- 401 Brehl Ave
- 425 S Central Ave
- 429 Brehl Ave
- 444 S Central Ave
- 386 S Central Ave Unit 388
- 386-388 S Central Ave
- 1421 Union Ave