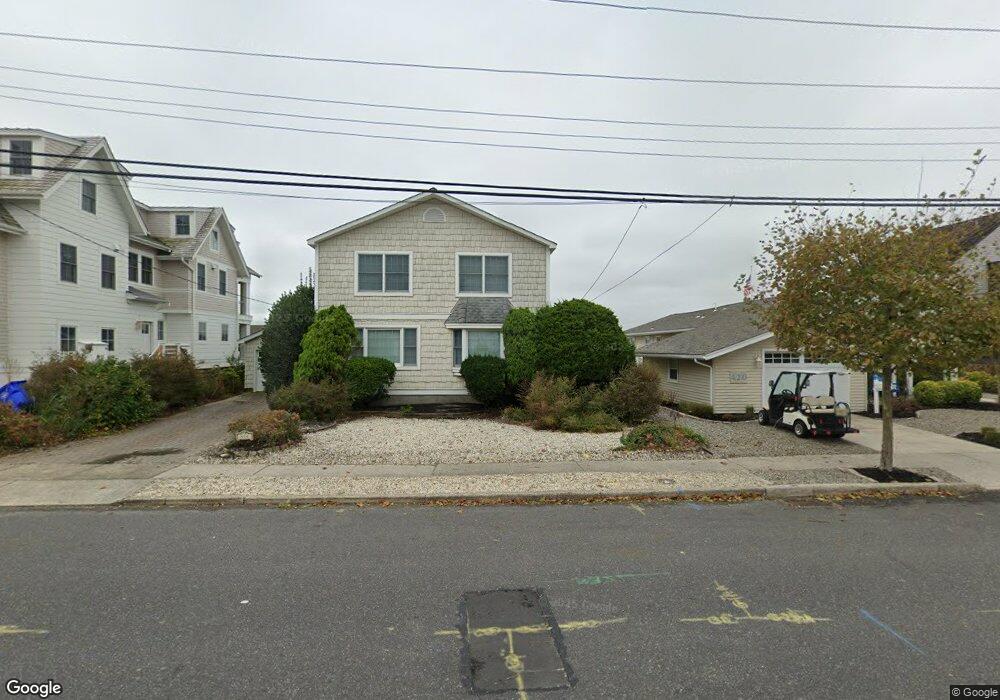
416 42nd St Avalon, NJ 08202
Estimated Value: $3,522,000 - $4,371,000
--
Bed
--
Bath
2,184
Sq Ft
$1,750/Sq Ft
Est. Value
About This Home
This home is located at 416 42nd St, Avalon, NJ 08202 and is currently estimated at $3,821,040, approximately $1,749 per square foot. 416 42nd St is a home with nearby schools including Avalon Elementary School.
Ownership History
Date
Name
Owned For
Owner Type
Purchase Details
Closed on
Apr 29, 2025
Sold by
Bayne William F and Bayne William J
Bought by
Bayne William J
Current Estimated Value
Purchase Details
Closed on
Oct 1, 1993
Sold by
Miller Craig A
Bought by
Bayne Wm F
Home Financials for this Owner
Home Financials are based on the most recent Mortgage that was taken out on this home.
Original Mortgage
$300,000
Interest Rate
7%
Purchase Details
Closed on
Sep 11, 1991
Sold by
New Jersey D E P
Bought by
Miller Kenneth and Miller Grace R
Create a Home Valuation Report for This Property
The Home Valuation Report is an in-depth analysis detailing your home's value as well as a comparison with similar homes in the area
Home Values in the Area
Average Home Value in this Area
Purchase History
| Date | Buyer | Sale Price | Title Company |
|---|---|---|---|
| Bayne William J | -- | None Listed On Document | |
| Bayne Wm F | $410,000 | -- | |
| Miller Kenneth | $3,700 | -- |
Source: Public Records
Mortgage History
| Date | Status | Borrower | Loan Amount |
|---|---|---|---|
| Previous Owner | Bayne Wm F | $300,000 |
Source: Public Records
Tax History Compared to Growth
Tax History
| Year | Tax Paid | Tax Assessment Tax Assessment Total Assessment is a certain percentage of the fair market value that is determined by local assessors to be the total taxable value of land and additions on the property. | Land | Improvement |
|---|---|---|---|---|
| 2025 | $11,516 | $1,875,600 | $1,700,000 | $175,600 |
| 2024 | $11,516 | $1,875,600 | $1,700,000 | $175,600 |
| 2023 | $11,422 | $1,875,600 | $1,700,000 | $175,600 |
| 2022 | $10,653 | $1,875,600 | $1,700,000 | $175,600 |
| 2021 | $10,260 | $1,875,600 | $1,700,000 | $175,600 |
| 2020 | $9,866 | $1,875,600 | $1,700,000 | $175,600 |
| 2019 | $9,566 | $1,875,600 | $1,700,000 | $175,600 |
| 2018 | $9,153 | $1,875,600 | $1,700,000 | $175,600 |
| 2017 | $9,876 | $1,776,200 | $1,600,000 | $176,200 |
| 2016 | $9,769 | $1,776,200 | $1,600,000 | $176,200 |
| 2015 | $9,609 | $1,776,200 | $1,600,000 | $176,200 |
| 2014 | $9,503 | $1,776,200 | $1,600,000 | $176,200 |
Source: Public Records
Map
Nearby Homes