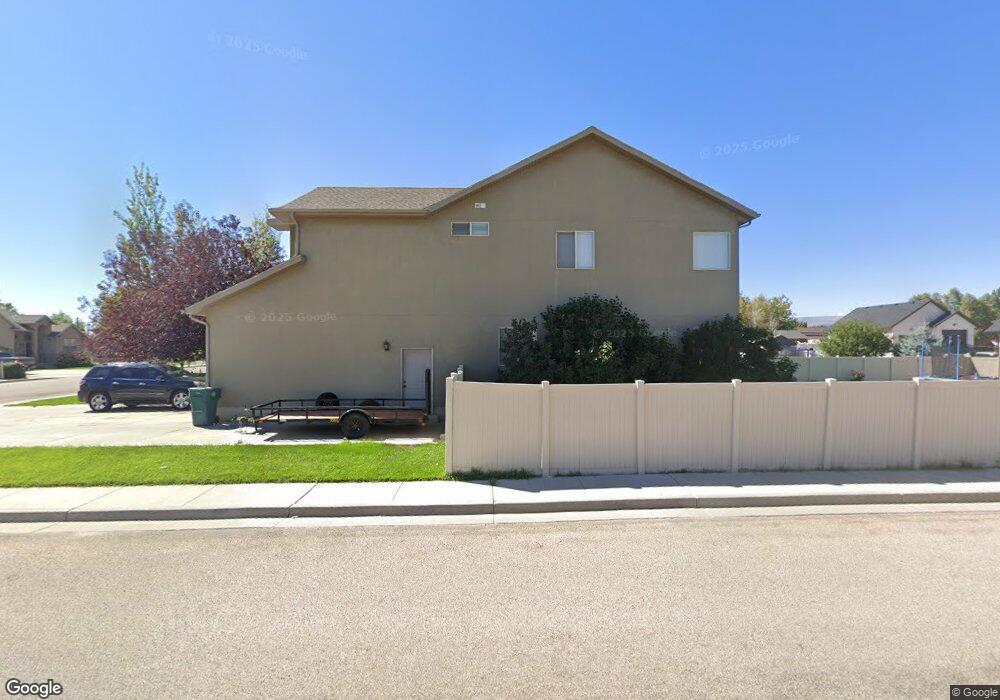
416 650 S Vernal, UT 84078
Estimated Value: $456,000 - $540,000
--
Bed
3
Baths
2,873
Sq Ft
$172/Sq Ft
Est. Value
About This Home
This home is located at 416 650 S, Vernal, UT 84078 and is currently estimated at $493,730, approximately $171 per square foot. 416 650 S is a home located in Uintah County with nearby schools including Discovery School, Vernal Middle School, and Uintah Middle School.
Ownership History
Date
Name
Owned For
Owner Type
Purchase Details
Closed on
Jan 6, 2020
Sold by
Bunnell Daniel R and Bunnell Wendy E
Bought by
Johnson Jason C and Johnson Aubri
Current Estimated Value
Home Financials for this Owner
Home Financials are based on the most recent Mortgage that was taken out on this home.
Original Mortgage
$325,757
Outstanding Balance
$287,819
Interest Rate
3.6%
Mortgage Type
New Conventional
Estimated Equity
$205,911
Purchase Details
Closed on
Jul 16, 2009
Sold by
Ferrin Spencer Page
Bought by
Ferrin Spencer Page and Ferrin Heather
Home Financials for this Owner
Home Financials are based on the most recent Mortgage that was taken out on this home.
Original Mortgage
$325,000
Interest Rate
5.25%
Mortgage Type
New Conventional
Purchase Details
Closed on
Jul 9, 2007
Sold by
Marcella Meadows Llc
Bought by
Evans Rita
Home Financials for this Owner
Home Financials are based on the most recent Mortgage that was taken out on this home.
Original Mortgage
$254,450
Interest Rate
6.41%
Mortgage Type
New Conventional
Create a Home Valuation Report for This Property
The Home Valuation Report is an in-depth analysis detailing your home's value as well as a comparison with similar homes in the area
Home Values in the Area
Average Home Value in this Area
Purchase History
| Date | Buyer | Sale Price | Title Company |
|---|---|---|---|
| Johnson Jason C | -- | None Available | |
| Ferrin Spencer Page | -- | -- | |
| Ferrin Spencer Page | -- | -- | |
| Evans Rita | -- | -- |
Source: Public Records
Mortgage History
| Date | Status | Borrower | Loan Amount |
|---|---|---|---|
| Open | Johnson Jason C | $325,757 | |
| Previous Owner | Ferrin Spencer Page | $325,000 | |
| Previous Owner | Evans Rita | $254,450 |
Source: Public Records
Tax History Compared to Growth
Tax History
| Year | Tax Paid | Tax Assessment Tax Assessment Total Assessment is a certain percentage of the fair market value that is determined by local assessors to be the total taxable value of land and additions on the property. | Land | Improvement |
|---|---|---|---|---|
| 2024 | $2,232 | $253,428 | $19,990 | $233,438 |
| 2023 | $2,232 | $249,895 | $19,094 | $230,801 |
| 2022 | $2,201 | $203,735 | $19,094 | $184,641 |
| 2021 | $2,214 | $93,064 | $10,502 | $82,563 |
| 2020 | $2,152 | $169,208 | $19,094 | $150,114 |
| 2019 | $2,113 | $163,973 | $22,000 | $141,973 |
| 2018 | $2,029 | $157,212 | $22,000 | $135,212 |
| 2017 | $20 | $159,962 | $24,750 | $135,212 |
| 2016 | $1,923 | $164,144 | $24,750 | $139,394 |
| 2015 | $1,855 | $171,480 | $24,750 | $146,730 |
| 2014 | $1,831 | $171,480 | $24,750 | $146,730 |
| 2013 | $1,870 | $171,480 | $24,750 | $146,730 |
Source: Public Records
Map
Nearby Homes