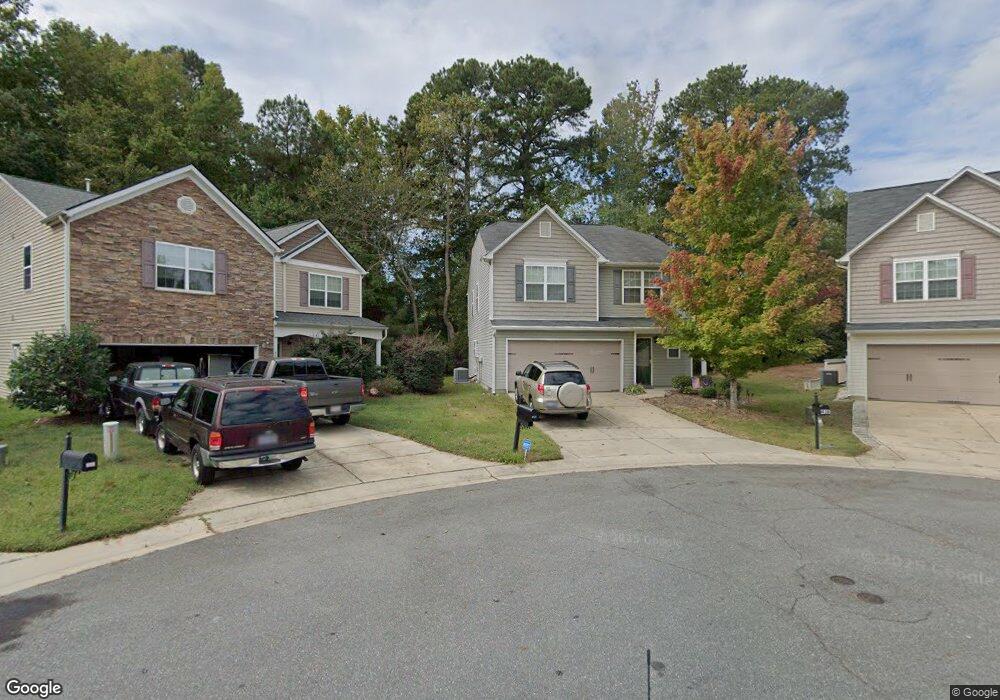
416 Ardross St Fuquay Varina, NC 27526
Estimated Value: $369,000 - $405,000
3
Beds
3
Baths
2,130
Sq Ft
$183/Sq Ft
Est. Value
About This Home
This home is located at 416 Ardross St, Fuquay Varina, NC 27526 and is currently estimated at $389,482, approximately $182 per square foot. 416 Ardross St is a home located in Wake County with nearby schools including Holly Grove Middle School and Fuquay-Varina High.
Ownership History
Date
Name
Owned For
Owner Type
Purchase Details
Closed on
Sep 28, 2024
Sold by
Reichbach Jerry and Reichbach Phyllis
Bought by
Reichbach Family Trust and Reichbach
Current Estimated Value
Purchase Details
Closed on
Aug 16, 2016
Sold by
Parrott Adam Lee and Parrott Lisa Carol
Bought by
Reichbach Jerry and Reichbach Phyllis
Home Financials for this Owner
Home Financials are based on the most recent Mortgage that was taken out on this home.
Original Mortgage
$193,000
Interest Rate
3.45%
Mortgage Type
VA
Purchase Details
Closed on
Jul 14, 2014
Sold by
Wade Jurney Homes
Bought by
Parrott Adam Lee and Parrott Lisa Carol
Home Financials for this Owner
Home Financials are based on the most recent Mortgage that was taken out on this home.
Original Mortgage
$169,387
Interest Rate
4.17%
Mortgage Type
New Conventional
Create a Home Valuation Report for This Property
The Home Valuation Report is an in-depth analysis detailing your home's value as well as a comparison with similar homes in the area
Home Values in the Area
Average Home Value in this Area
Purchase History
| Date | Buyer | Sale Price | Title Company |
|---|---|---|---|
| Reichbach Family Trust | -- | None Listed On Document | |
| Reichbach Jerry | $193,000 | None Available | |
| Parrott Adam Lee | $166,000 | None Available |
Source: Public Records
Mortgage History
| Date | Status | Borrower | Loan Amount |
|---|---|---|---|
| Previous Owner | Reichbach Jerry | $193,000 | |
| Previous Owner | Parrott Adam Lee | $169,387 |
Source: Public Records
Tax History Compared to Growth
Tax History
| Year | Tax Paid | Tax Assessment Tax Assessment Total Assessment is a certain percentage of the fair market value that is determined by local assessors to be the total taxable value of land and additions on the property. | Land | Improvement |
|---|---|---|---|---|
| 2025 | $3,340 | $379,388 | $80,000 | $299,388 |
| 2024 | $3,326 | $379,388 | $80,000 | $299,388 |
| 2023 | $2,761 | $246,473 | $45,000 | $201,473 |
| 2022 | $2,594 | $246,473 | $45,000 | $201,473 |
| 2021 | $2,472 | $246,473 | $45,000 | $201,473 |
| 2020 | $2,472 | $246,473 | $45,000 | $201,473 |
| 2019 | $2,088 | $179,291 | $40,000 | $139,291 |
| 2018 | $1,969 | $179,291 | $40,000 | $139,291 |
| 2017 | $1,898 | $179,291 | $40,000 | $139,291 |
| 2016 | $1,872 | $179,291 | $40,000 | $139,291 |
| 2015 | $1,787 | $176,785 | $44,000 | $132,785 |
| 2014 | -- | $44,000 | $44,000 | $0 |
Source: Public Records
Map
Nearby Homes
- 114 Tweedbank Ct
- 105 Bridge St
- 716 Parker St
- 104 Lawrence St
- 637 Stapleford Ln
- 664 Lavenham Ln
- 909 Sunset Dr
- 121 N West St
- 137 Coley Farm Rd
- 306 Country Side Way
- 318 Country Side Way
- 77 Saintsbury Dr
- 63 Saintsbury Dr
- 2200 Astride Way
- 146 Rusling Leaf Dr
- 609 Dorset Stream Dr
- 605 Dorset Stream Dr
- 724 Lucky Clover Way
- 722 Lucky Clover Way
- 720 Lucky Clover Way
- 416 Aspen Grove Dr
- 412 Ardross St
- 413 Ardross St
- 409 Ardross St
- 408 Ardross St
- 405 Ardross St
- 130 Charndon Way
- 401 Ardross St
- 126 Charndon Way
- 121 Tweedbank Ct
- 122 Tweedbank Ct
- 347 Ardross St
- 122 Charndon Way
- 137 Charndon Way
- 135 Charndon Way
- 343 Ardross St
- 131 Charndon Way
- 118 Charndon Way
- 127 Charndon Way
- 415 Stapleford Ln