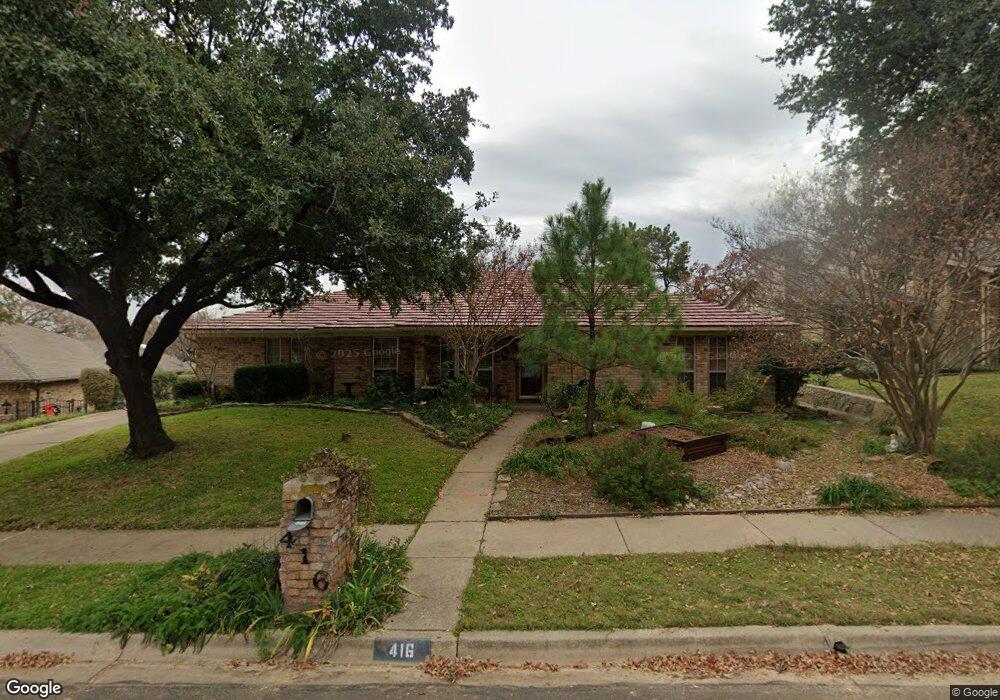
416 Blue Jay Ct Bedford, TX 76021
Estimated Value: $494,000 - $536,217
4
Beds
3
Baths
3,096
Sq Ft
$167/Sq Ft
Est. Value
About This Home
This home is located at 416 Blue Jay Ct, Bedford, TX 76021 and is currently estimated at $515,554, approximately $166 per square foot. 416 Blue Jay Ct is a home located in Tarrant County with nearby schools including Bedford Heights Elementary School, Bedford Junior High School, and L.D. Bell High School.
Ownership History
Date
Name
Owned For
Owner Type
Purchase Details
Closed on
Jul 15, 1999
Sold by
Lafontaine Delmore M and Lafontaine Tracey
Bought by
Mendez George and Mendez Theresa
Current Estimated Value
Home Financials for this Owner
Home Financials are based on the most recent Mortgage that was taken out on this home.
Original Mortgage
$143,200
Outstanding Balance
$39,573
Interest Rate
7.39%
Estimated Equity
$475,981
Purchase Details
Closed on
May 11, 1998
Sold by
Yingst Thomas E and Yingst Ardis M
Bought by
Lafontaine Delmore M and Lafontaine Tracey
Home Financials for this Owner
Home Financials are based on the most recent Mortgage that was taken out on this home.
Original Mortgage
$154,000
Interest Rate
7.18%
Create a Home Valuation Report for This Property
The Home Valuation Report is an in-depth analysis detailing your home's value as well as a comparison with similar homes in the area
Home Values in the Area
Average Home Value in this Area
Purchase History
We collect this data history from publicly available records. To have your information removed, we recommend requesting removal directly through your county’s website.
| Date | Buyer | Sale Price | Title Company |
|---|---|---|---|
| Mendez George | -- | -- | |
| Lafontaine Delmore M | -- | Commonwealth Land Title |
Source: Public Records
Mortgage History
We collect this data history from publicly available records. To have your information removed, we recommend requesting removal directly through your county’s website.
| Date | Status | Borrower | Loan Amount |
|---|---|---|---|
| Open | Mendez George | $143,200 | |
| Previous Owner | Lafontaine Delmore M | $154,000 | |
| Closed | Mendez George | $17,900 |
Source: Public Records
Tax History
| Year | Tax Paid | Tax Assessment Tax Assessment Total Assessment is a certain percentage of the fair market value that is determined by local assessors to be the total taxable value of land and additions on the property. | Land | Improvement |
|---|---|---|---|---|
| 2025 | $5,692 | $470,000 | $100,000 | $370,000 |
| 2024 | $5,692 | $546,077 | $100,000 | $446,077 |
| 2023 | $8,123 | $543,033 | $75,000 | $468,033 |
| 2022 | $8,409 | $385,000 | $75,000 | $310,000 |
| 2021 | $9,768 | $414,673 | $75,000 | $339,673 |
| 2020 | $9,365 | $393,867 | $75,000 | $318,867 |
| 2019 | $8,874 | $380,571 | $75,000 | $305,571 |
| 2018 | $7,686 | $332,085 | $75,000 | $257,085 |
| 2017 | $7,303 | $329,619 | $45,000 | $284,619 |
| 2016 | $6,639 | $319,076 | $45,000 | $274,076 |
| 2015 | $5,991 | $249,500 | $26,000 | $223,500 |
| 2014 | $5,991 | $249,500 | $26,000 | $223,500 |
Source: Public Records
Map
Nearby Homes
- 3006 Wayside Dr
- 410 Carolyn Dr
- 3009 Shenandoah Dr
- 2036 Parkridge Ct
- 3309 Timber View Cir
- 3113 Spring Grove Dr
- 3409 San Bar Ln
- 215 Mountainview Dr
- 704 Morning Glory Ln
- 901 Shady Creek Ln
- 2809 Greg Dr
- 3609 Wayne Ct
- 853 Spring Lake Dr
- 3716 Sweetbriar Ln
- 930 Shady Creek Ln
- 1760 Acorn Ln
- 937 Harwood Terrace
- 104 Greenbriar Ln
- 3813 Fox Hollow Dr
- 333 Mountainview Dr
- 412 Blue Jay Ct
- 420 Blue Jay Ct
- 408 Blue Jay Ct
- 417 Blue Jay Ct
- 413 Blue Jay Ct
- 424 Blue Jay Ct
- 409 Blue Jay Ct
- 428 Blue Jay Ct
- 404 Blue Jay Ct
- 416 Eagle Dr
- 420 Eagle Dr
- 405 Blue Jay Ct
- 412 Eagle Dr
- 432 Blue Jay Ct
- 408 Eagle Dr
- 400 Blue Jay Ct
- 401 Blue Jay Ct
- 504 Eagle Dr
- 3209 Brown Trail
- 417 Eagle Dr
Your Personal Tour Guide
Ask me questions while you tour the home.