Estimated Value: $393,425 - $450,000
4
Beds
3
Baths
2,266
Sq Ft
$186/Sq Ft
Est. Value
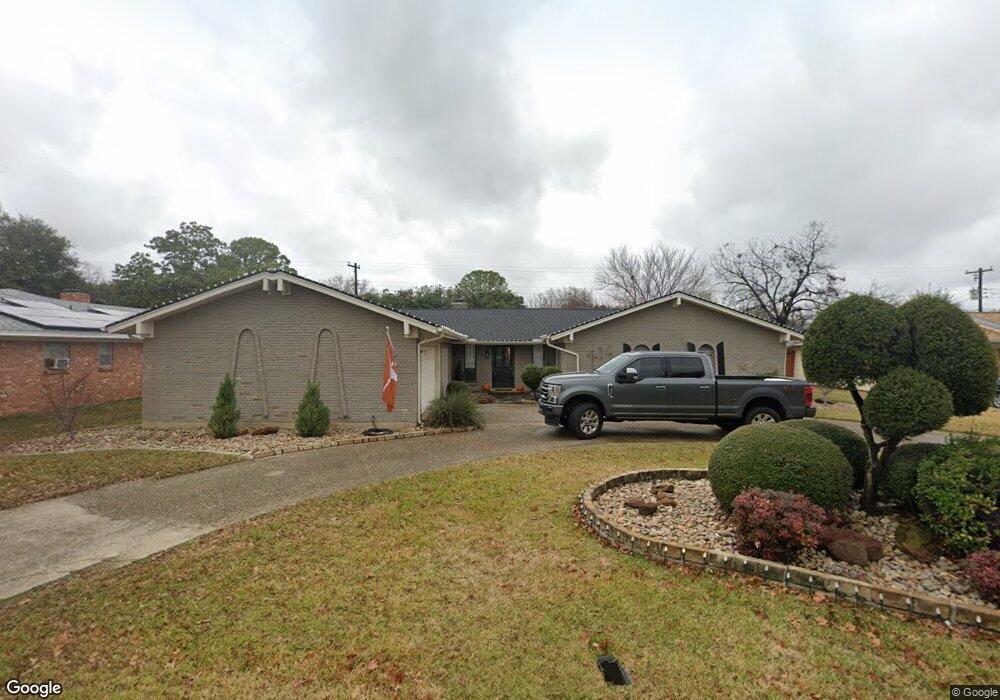
About This Home
This home is located at 416 Brookview Dr, Hurst, TX 76054 and is currently estimated at $421,606, approximately $186 per square foot. 416 Brookview Dr is a home located in Tarrant County with nearby schools including Shady Oaks Elementary School, Bedford Junior High School, and L.D. Bell High School.
Ownership History
Date
Name
Owned For
Owner Type
Purchase Details
Closed on
Apr 20, 2020
Sold by
Avants Durand and Avants Jennifer
Bought by
Avants Durand
Current Estimated Value
Home Financials for this Owner
Home Financials are based on the most recent Mortgage that was taken out on this home.
Original Mortgage
$257,700
Outstanding Balance
$229,230
Interest Rate
3.62%
Mortgage Type
New Conventional
Estimated Equity
$192,376
Purchase Details
Closed on
May 30, 2017
Sold by
Tk Homes Llc
Bought by
Avants Durand and Avants Jennifer
Home Financials for this Owner
Home Financials are based on the most recent Mortgage that was taken out on this home.
Original Mortgage
$247,500
Interest Rate
3.97%
Mortgage Type
New Conventional
Purchase Details
Closed on
Mar 16, 2017
Sold by
Jaget Blackmon Laura K and Blackmon Laura
Bought by
Tk Homes Llc
Purchase Details
Closed on
Jan 26, 1996
Sold by
Jaget Mary Ann Claunch
Bought by
Blackmon Laura K Jaget and Laura K Jaget Blackmon Inheritance Trust
Create a Home Valuation Report for This Property
The Home Valuation Report is an in-depth analysis detailing your home's value as well as a comparison with similar homes in the area
Home Values in the Area
Average Home Value in this Area
Purchase History
We collect this data history from publicly available records. To have your information removed, we recommend requesting removal directly through your county’s website.
| Date | Buyer | Sale Price | Title Company |
|---|---|---|---|
| Avants Durand | -- | None Available | |
| Avants Durand | -- | None Available | |
| Tk Homes Llc | -- | None Available | |
| Blackmon Laura K Jaget | -- | -- |
Source: Public Records
Mortgage History
We collect this data history from publicly available records. To have your information removed, we recommend requesting removal directly through your county’s website.
| Date | Status | Borrower | Loan Amount |
|---|---|---|---|
| Open | Avants Durand | $257,700 | |
| Closed | Avants Durand | $247,500 |
Source: Public Records
Tax History
| Year | Tax Paid | Tax Assessment Tax Assessment Total Assessment is a certain percentage of the fair market value that is determined by local assessors to be the total taxable value of land and additions on the property. | Land | Improvement |
|---|---|---|---|---|
| 2025 | $6,057 | $366,000 | $80,000 | $286,000 |
| 2024 | $6,057 | $388,462 | $80,000 | $308,462 |
| 2023 | $6,969 | $418,136 | $55,000 | $363,136 |
| 2022 | $7,281 | $348,615 | $55,000 | $293,615 |
| 2021 | $6,934 | $287,500 | $55,000 | $232,500 |
| 2020 | $6,917 | $287,500 | $55,000 | $232,500 |
| 2019 | $7,037 | $287,500 | $55,000 | $232,500 |
| 2018 | $6,168 | $280,939 | $55,000 | $225,939 |
| 2017 | $4,440 | $209,091 | $40,000 | $169,091 |
| 2016 | $4,036 | $179,973 | $40,000 | $139,973 |
| 2015 | $2,069 | $145,000 | $17,000 | $128,000 |
| 2014 | $2,069 | $145,000 | $17,000 | $128,000 |
Source: Public Records
Map
Nearby Homes
- 224 Plainview Dr
- 612 Circleview Dr S
- 440 W Louella Dr
- 600 Circleview Dr N
- 520 Baker Dr
- 604 Baker Dr
- 404 Glenwood Terrace
- 205 Circleview Dr N
- 200 Hillview Dr
- 1352 Simpson Dr
- 709 Thousand Oaks Dr
- 461 Shade Tree Ct
- 716 Thousand Oaks Dr
- 1705 Louella Ct
- 1617 Westridge Dr
- 330 W Harwood Rd Unit D
- 1917 Mesquite Trail
- 333 Mountainview Dr
- 1229 Brookside Dr
- 421 Cavender Ct
- 412 Brookview Dr
- 420 Brookview Dr
- 417 W Pleasantview Dr
- 413 W Pleasantview Dr
- 421 W Pleasantview Dr
- 408 Brookview Dr
- 417 Brookview Dr
- 424 Brookview Dr
- 413 Brookview Dr
- 421 Brookview Dr
- 409 W Pleasantview Dr
- 409 Brookview Dr
- 425 Brookview Dr
- 428 Brookview Dr
- 404 Brookview Dr
- 405 W Pleasantview Dr
- 416 Plainview Dr
- 429 W Pleasantview Dr
- 412 Plainview Dr
- 405 Brookview Dr
Your Personal Tour Guide
Ask me questions while you tour the home.