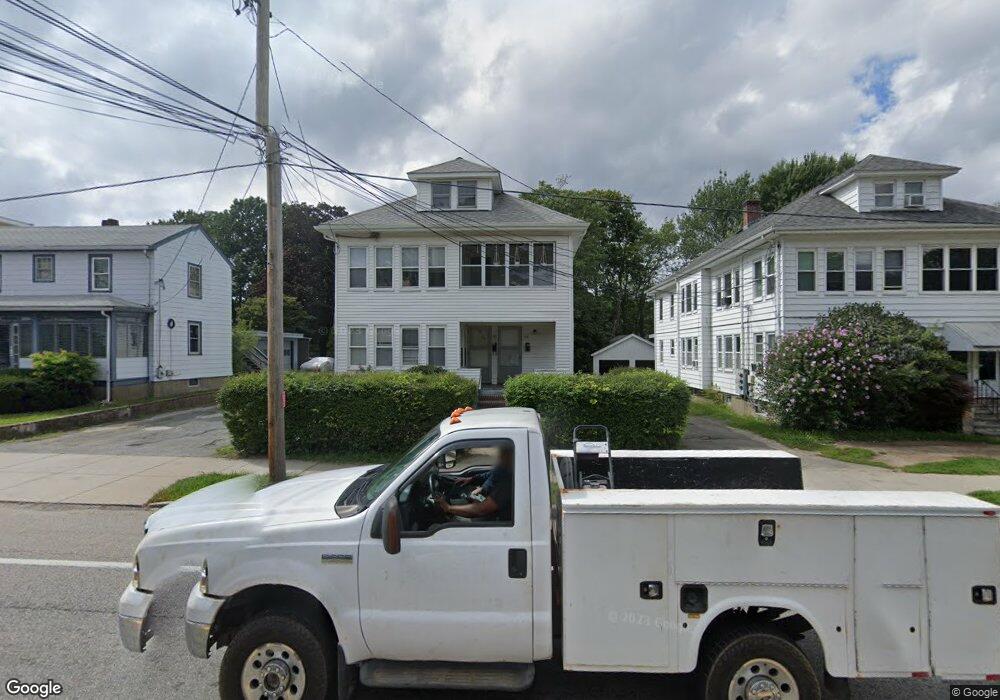
416 Concord St Unit 2 Framingham, MA 01702
Estimated Value: $783,648 - $946,000
3
Beds
1
Bath
1,300
Sq Ft
$685/Sq Ft
Est. Value
About This Home
This home is located at 416 Concord St Unit 2, Framingham, MA 01702 and is currently estimated at $890,412, approximately $684 per square foot. 416 Concord St Unit 2 is a home located in Middlesex County with nearby schools including Framingham High School, Christa McAuliffe Charter School, and Happy Hollow School.
Ownership History
Date
Name
Owned For
Owner Type
Purchase Details
Closed on
Mar 30, 2022
Sold by
Falone Frederick J and Falone Christine M
Bought by
Daly Mekala and Daly Russell J
Current Estimated Value
Home Financials for this Owner
Home Financials are based on the most recent Mortgage that was taken out on this home.
Original Mortgage
$517,144
Outstanding Balance
$484,043
Interest Rate
3.92%
Mortgage Type
FHA
Estimated Equity
$406,369
Purchase Details
Closed on
Feb 1, 1999
Sold by
Hausner Arlene S and Sokolov Carol
Bought by
Falone Frederick J and Falone Christine M
Home Financials for this Owner
Home Financials are based on the most recent Mortgage that was taken out on this home.
Original Mortgage
$230,850
Interest Rate
6.67%
Mortgage Type
Purchase Money Mortgage
Create a Home Valuation Report for This Property
The Home Valuation Report is an in-depth analysis detailing your home's value as well as a comparison with similar homes in the area
Home Values in the Area
Average Home Value in this Area
Purchase History
| Date | Buyer | Sale Price | Title Company |
|---|---|---|---|
| Daly Mekala | $600,000 | None Available | |
| Daly Mekala | $600,000 | None Available | |
| Falone Frederick J | $243,000 | -- |
Source: Public Records
Mortgage History
| Date | Status | Borrower | Loan Amount |
|---|---|---|---|
| Open | Daly Mekala | $517,144 | |
| Closed | Daly Mekala | $517,144 | |
| Previous Owner | Falone Frederick J | $230,850 |
Source: Public Records
Tax History Compared to Growth
Tax History
| Year | Tax Paid | Tax Assessment Tax Assessment Total Assessment is a certain percentage of the fair market value that is determined by local assessors to be the total taxable value of land and additions on the property. | Land | Improvement |
|---|---|---|---|---|
| 2025 | $8,241 | $690,200 | $217,600 | $472,600 |
| 2024 | $7,177 | $576,000 | $195,000 | $381,000 |
| 2023 | $6,969 | $532,400 | $174,700 | $357,700 |
| 2022 | $6,841 | $497,900 | $158,700 | $339,200 |
| 2021 | $6,334 | $450,800 | $152,600 | $298,200 |
| 2020 | $5,890 | $393,200 | $132,700 | $260,500 |
| 2019 | $5,321 | $346,000 | $128,900 | $217,100 |
| 2018 | $5,149 | $315,500 | $115,900 | $199,600 |
| 2017 | $4,843 | $289,800 | $112,600 | $177,200 |
| 2016 | $4,752 | $273,400 | $109,000 | $164,400 |
| 2015 | $4,863 | $272,900 | $108,600 | $164,300 |
Source: Public Records
Map
Nearby Homes
- 88 Pond St Unit 88
- 11 Robertson Rd
- 159 Bishop St
- 369 Grant St
- 369 Grant St Unit 1
- 369 Grant St Unit 2
- 369 Grant St Unit 3
- 101 Bishop Dr Unit 101
- 47 Clinton St
- 155 Bishop Dr
- 18 Milton St
- 126 Bishop Dr
- 31 Palmer Rd
- 108 Warren Rd
- 143 Howe St
- 6 Clarks Hill Ln Unit 6
- 25 Brewster Rd
- 26 Willis St Unit 33
- 36 Nelson St
- 120 Franklin St
- 416 Concord St
- 422 Concord St Unit 422
- 422 Concord St
- 420 Concord St
- 414 Concord St
- 424 Concord St
- 412 Concord St
- 430 Concord St
- 430 Concord St Unit Upper
- 423 Concord St
- 432 Concord St
- 419 Concord St
- 423 Concord St
- 427 Concord St
- 400 Concord St Unit 1
- 431 Concord St
- 431 Concord St Unit 431
- 403 Concord St
- 14 Arthur St
- 399 Concord St