Estimated Value: $285,000 - $346,000
3
Beds
2
Baths
1,585
Sq Ft
$196/Sq Ft
Est. Value
About This Home
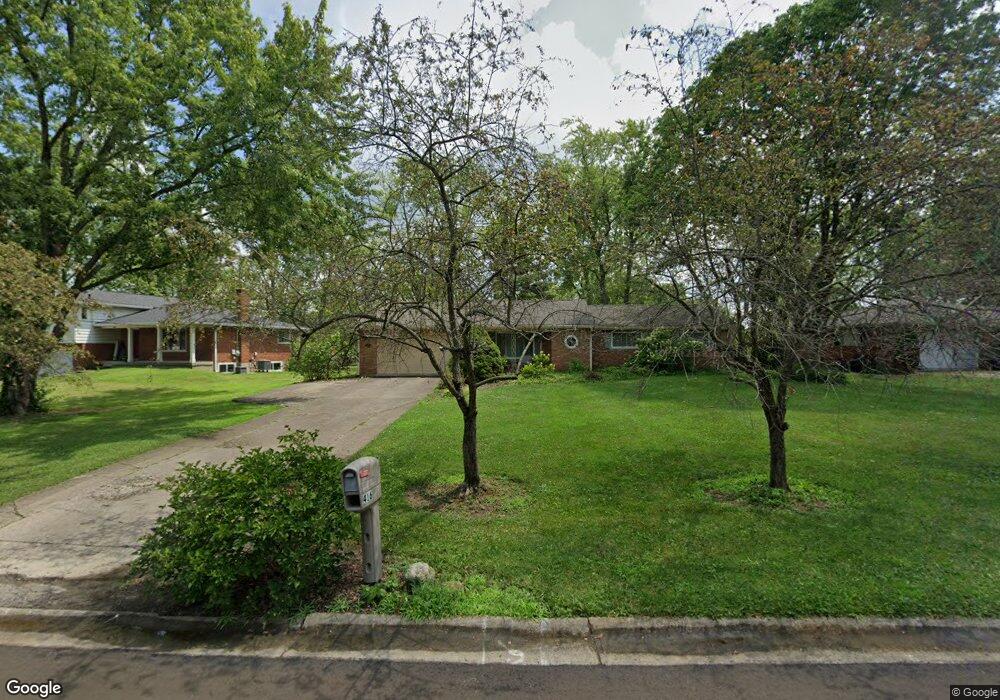
This home is located at 416 David Ln, Mason, OH 45040 and is currently estimated at $310,835, approximately $196 per square foot. 416 David Ln is a home located in Warren County with nearby schools including Mason Intermediate Elementary School, Mason Middle School, and William Mason High School.
Ownership History
Date
Name
Owned For
Owner Type
Purchase Details
Closed on
Jul 17, 1997
Sold by
Sweet John B
Bought by
Qualkinbush Jennifer J
Current Estimated Value
Home Financials for this Owner
Home Financials are based on the most recent Mortgage that was taken out on this home.
Original Mortgage
$75,000
Outstanding Balance
$9,257
Interest Rate
7.94%
Mortgage Type
New Conventional
Estimated Equity
$301,578
Purchase Details
Closed on
Oct 23, 1991
Sold by
Nestor Nestor and Nestor Jacquelyn A
Bought by
Sweet Sweet and Sweet John B
Purchase Details
Closed on
Apr 13, 1988
Sold by
Thomas Dennis and Thomas Dennis
Bought by
Nestor Nestor and Nestor Jacquelyn A
Purchase Details
Closed on
Nov 6, 1986
Sold by
Estes Jewell and Estes Jewell
Bought by
Dennis and Dennis Thomas
Purchase Details
Closed on
Jul 30, 1986
Sold by
Estes Jewell and Estes Jewell
Bought by
Jewell Estes and Jewell Jewell
Purchase Details
Closed on
May 14, 1982
Sold by
Hughes Hughes and Hughes Homer C
Purchase Details
Closed on
Apr 23, 1982
Sold by
Hughes Hughes and Hughes Martha
Create a Home Valuation Report for This Property
The Home Valuation Report is an in-depth analysis detailing your home's value as well as a comparison with similar homes in the area
Home Values in the Area
Average Home Value in this Area
Purchase History
| Date | Buyer | Sale Price | Title Company |
|---|---|---|---|
| Qualkinbush Jennifer J | $112,500 | -- | |
| Sweet Sweet | $88,000 | -- | |
| Nestor Nestor | $76,000 | -- | |
| Dennis | $69,000 | -- | |
| Jewell Estes | -- | -- | |
| -- | -- | -- | |
| -- | -- | -- |
Source: Public Records
Mortgage History
| Date | Status | Borrower | Loan Amount |
|---|---|---|---|
| Open | Qualkinbush Jennifer J | $75,000 |
Source: Public Records
Tax History
| Year | Tax Paid | Tax Assessment Tax Assessment Total Assessment is a certain percentage of the fair market value that is determined by local assessors to be the total taxable value of land and additions on the property. | Land | Improvement |
|---|---|---|---|---|
| 2025 | $2,796 | $78,690 | $24,500 | $54,190 |
| 2024 | $2,796 | $78,690 | $24,500 | $54,190 |
| 2023 | $2,616 | $63,206 | $15,067 | $48,139 |
| 2022 | $2,997 | $63,207 | $15,068 | $48,139 |
| 2021 | $2,839 | $63,207 | $15,068 | $48,139 |
| 2020 | $2,692 | $51,387 | $12,250 | $39,137 |
| 2019 | $2,475 | $51,387 | $12,250 | $39,137 |
| 2018 | $2,483 | $51,387 | $12,250 | $39,137 |
| 2017 | $2,410 | $46,543 | $11,267 | $35,277 |
| 2016 | $2,482 | $46,543 | $11,267 | $35,277 |
| 2015 | $2,487 | $46,543 | $11,267 | $35,277 |
| 2014 | $2,424 | $42,310 | $10,240 | $32,070 |
| 2013 | $2,430 | $50,610 | $12,250 | $38,360 |
Source: Public Records
Map
Nearby Homes
- 5921 Fairway Dr
- 382 Walnut Ln
- 602 Bunker Ln
- 618 Bunker Ln
- 4109 Old Manchester Ct
- 3856 Sandtrap Cir
- 6416 Eagleview Dr
- 4019 Fieldsedge Dr
- 3634 Pebble Creek Ct
- 220 Kings Mills Rd
- 6674 Villager Place Unit 153D
- 6764 Pondfield Ln
- 6768 Pondfield Ln Unit 271E
- 6510 Prestwick Ct
- 5873 Falling Brook Dr
- 5399 Country Ridge Dr
- 5533 Cox-Smith Rd
- 5523 Cox-Smith Rd
- 5513 Cox-Smith Rd
- 5276 Bay Pointe Dr
Your Personal Tour Guide
Ask me questions while you tour the home.