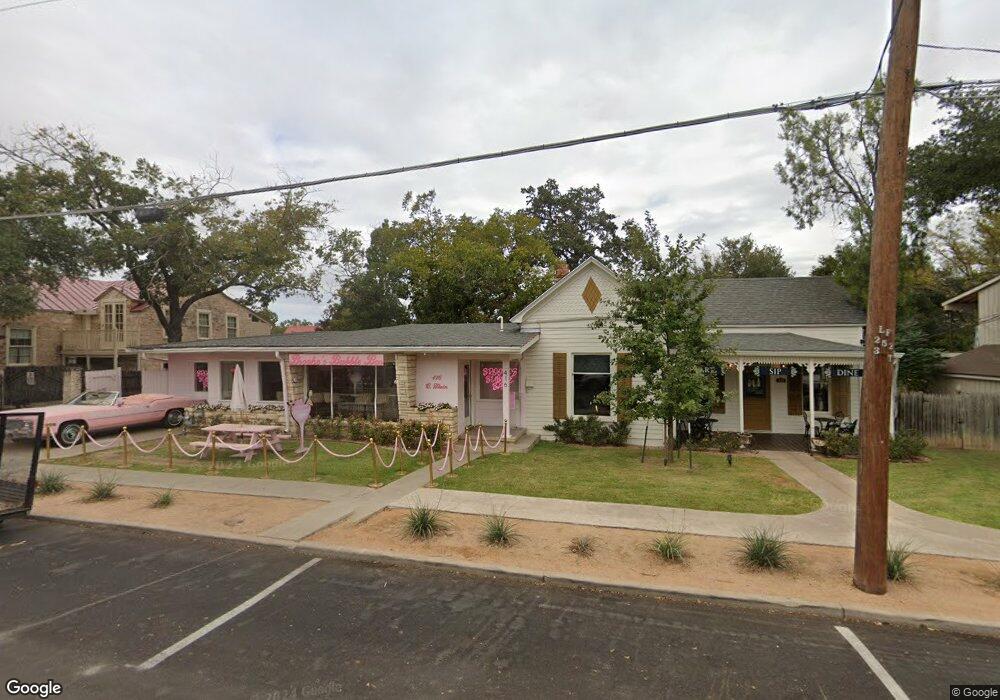
416 E Main St Fredericksburg, TX 78624
Estimated Value: $1,165,672
Studio
2
Baths
1,464
Sq Ft
$796/Sq Ft
Est. Value
About This Home
This home is located at 416 E Main St, Fredericksburg, TX 78624 and is currently estimated at $1,165,672, approximately $796 per square foot. 416 E Main St is a home located in Gillespie County with nearby schools including Fredericksburg High School, St. Mary's Catholic School, and Ambleside School of Fredericksburg.
Ownership History
Date
Name
Owned For
Owner Type
Purchase Details
Closed on
Mar 11, 2021
Sold by
Lazy Oak Arc Llc
Bought by
Stout House Holdings Llc
Current Estimated Value
Home Financials for this Owner
Home Financials are based on the most recent Mortgage that was taken out on this home.
Original Mortgage
$744,000
Outstanding Balance
$660,855
Interest Rate
2.7%
Mortgage Type
Commercial
Estimated Equity
$504,817
Purchase Details
Closed on
Sep 30, 2016
Sold by
Jedrzejewski Anna M
Bought by
Lazy Oak Arc Llc
Purchase Details
Closed on
Jul 7, 2016
Sold by
Barn 9 Llc
Bought by
Jedrzejewski Anna M
Purchase Details
Closed on
Jun 9, 2016
Sold by
Guzy Marrk R
Bought by
Barn 9 Llc
Create a Home Valuation Report for This Property
The Home Valuation Report is an in-depth analysis detailing your home's value as well as a comparison with similar homes in the area
Purchase History
| Date | Buyer | Sale Price | Title Company |
|---|---|---|---|
| Stout House Holdings Llc | -- | Countywide Title | |
| Lazy Oak Arc Llc | -- | None Available | |
| Jedrzejewski Anna M | -- | Countywide Title | |
| Barn 9 Llc | -- | None Available |
Source: Public Records
Mortgage History
| Date | Status | Borrower | Loan Amount |
|---|---|---|---|
| Open | Stout House Holdings Llc | $744,000 |
Source: Public Records
Tax History
| Year | Tax Paid | Tax Assessment Tax Assessment Total Assessment is a certain percentage of the fair market value that is determined by local assessors to be the total taxable value of land and additions on the property. | Land | Improvement |
|---|---|---|---|---|
| 2025 | $22,742 | $1,547,434 | $760,700 | $1,055,920 |
| 2024 | $22,742 | $1,177,320 | $624,860 | $552,460 |
| 2023 | $13,578 | $1,108,360 | $624,860 | $483,500 |
| 2022 | $14,296 | $956,600 | $611,280 | $345,320 |
| 2021 | $13,848 | $820,940 | $482,230 | $338,710 |
| 2020 | $9,420 | $546,930 | $432,220 | $114,710 |
| 2019 | $9,770 | $546,770 | $432,220 | $114,550 |
| 2018 | $8,579 | $482,230 | $370,470 | $111,760 |
| 2017 | $8,660 | $473,640 | $370,470 | $103,170 |
| 2016 | $6,894 | $377,030 | $284,030 | $93,000 |
| 2015 | -- | $377,030 | $284,030 | $93,000 |
| 2014 | -- | $377,010 | $284,010 | $93,000 |
Source: Public Records
Map
Nearby Homes
- 4584 Highway 290 Unit 282
- 4584 Highway 290 Unit 266
- 4584 Highway 290 Unit 318
- 4584 Highway 290 Unit 248
- 4584 Highway 290 Unit 304R
- 5396 U S 290
- 171 Juanita Way
- 197 Juanita Way
- 187 Juanita Way
- 175 Juanita Way
- 173 Juanita Way
- 191 Juanita Way
- 403 E Schubert St
- 209 N Elk St
- 305 N Elk St
- 86 Beaumont Dr
- 11208 Highway 290
- 9848 Highway 290
- 3567 Highway 290
- 308 E Travis St
- 414 E Main St
- 412 & 414 E Main St
- 0A U S 290
- 424 E Main St
- 425 E Main St
- 415 E Main St
- 411 E Main St
- 409 E Main St
- 405 E Main St
- 415 E Austin St
- 406 E Main St
- 4584 Highway 290 Unit AR312
- 3841 W Highway 290
- 4160 U S 290 Unit 12
- 202 N Elk St
- 401 E Main St
- 107 N Washington St
- 5112 LOT 88 U S 290
- 107 S Elk St
- 416 E Austin St
Your Personal Tour Guide
Ask me questions while you tour the home.