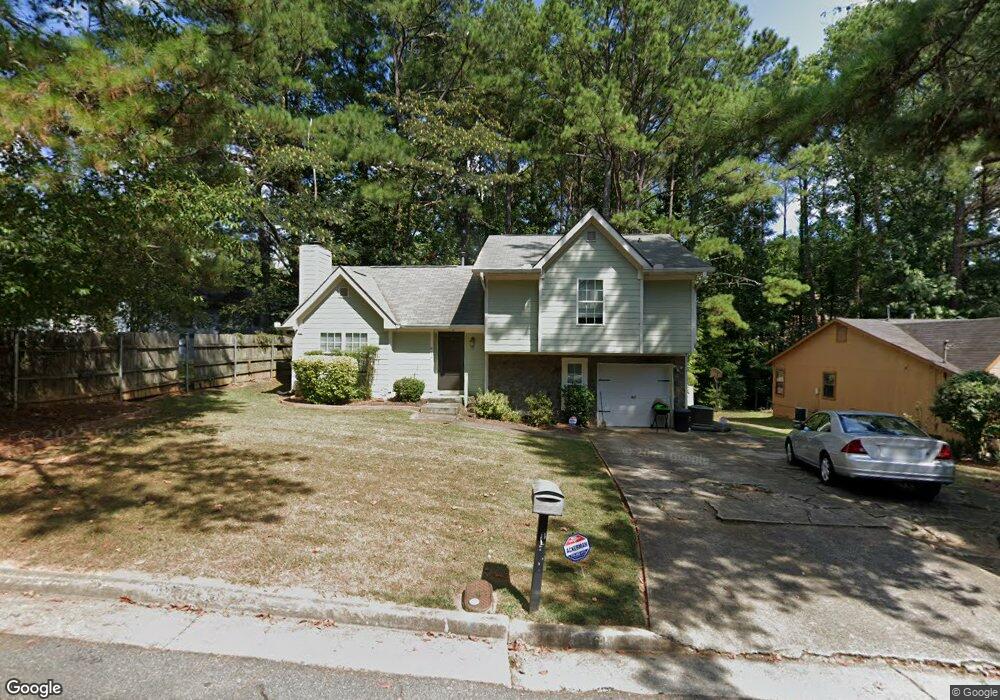
416 Fennel Way SW Atlanta, GA 30331
Wilson Mill Meadows NeighborhoodEstimated Value: $222,000 - $252,000
3
Beds
3
Baths
1,203
Sq Ft
$194/Sq Ft
Est. Value
About This Home
This home is located at 416 Fennel Way SW, Atlanta, GA 30331 and is currently estimated at $232,894, approximately $193 per square foot. 416 Fennel Way SW is a home located in Fulton County with nearby schools including L.P. Miles Elementary School, Young Middle School, and Mays High School.
Ownership History
Date
Name
Owned For
Owner Type
Purchase Details
Closed on
Jul 12, 2007
Sold by
University Cmnty Dev Corp
Bought by
Whipple Comalethia
Current Estimated Value
Home Financials for this Owner
Home Financials are based on the most recent Mortgage that was taken out on this home.
Original Mortgage
$108,000
Outstanding Balance
$67,044
Interest Rate
6.37%
Mortgage Type
New Conventional
Estimated Equity
$165,850
Purchase Details
Closed on
Oct 31, 2006
Sold by
City Of Atlanta
Bought by
University Community Dev Corp
Home Financials for this Owner
Home Financials are based on the most recent Mortgage that was taken out on this home.
Original Mortgage
$102,000
Interest Rate
6.05%
Purchase Details
Closed on
Oct 7, 2003
Sold by
Mortgage Electronic Registration
Bought by
Hud
Purchase Details
Closed on
May 5, 1998
Sold by
Hud
Bought by
Jones Stephen L
Home Financials for this Owner
Home Financials are based on the most recent Mortgage that was taken out on this home.
Original Mortgage
$79,346
Interest Rate
7.14%
Mortgage Type
FHA
Create a Home Valuation Report for This Property
The Home Valuation Report is an in-depth analysis detailing your home's value as well as a comparison with similar homes in the area
Home Values in the Area
Average Home Value in this Area
Purchase History
| Date | Buyer | Sale Price | Title Company |
|---|---|---|---|
| Whipple Comalethia | $135,000 | -- | |
| University Community Dev Corp | -- | -- | |
| City Of Atlanta | -- | -- | |
| Hud | -- | -- | |
| Mortgage Electronic Registration | $102,169 | -- | |
| Jones Stephen L | -- | -- |
Source: Public Records
Mortgage History
| Date | Status | Borrower | Loan Amount |
|---|---|---|---|
| Open | Whipple Comalethia | $108,000 | |
| Previous Owner | City Of Atlanta | $102,000 | |
| Previous Owner | Jones Stephen L | $79,346 |
Source: Public Records
Tax History Compared to Growth
Tax History
| Year | Tax Paid | Tax Assessment Tax Assessment Total Assessment is a certain percentage of the fair market value that is determined by local assessors to be the total taxable value of land and additions on the property. | Land | Improvement |
|---|---|---|---|---|
| 2025 | $948 | $79,320 | $25,520 | $53,800 |
| 2023 | $3,650 | $88,160 | $25,280 | $62,880 |
| 2022 | $978 | $78,520 | $15,960 | $62,560 |
| 2021 | $517 | $51,640 | $8,880 | $42,760 |
| 2020 | $520 | $51,000 | $8,760 | $42,240 |
| 2019 | $490 | $41,000 | $6,680 | $34,320 |
| 2018 | $51 | $24,200 | $3,640 | $20,560 |
| 2017 | $26 | $15,240 | $3,080 | $12,160 |
| 2016 | $27 | $15,240 | $3,080 | $12,160 |
| 2015 | $516 | $15,240 | $3,080 | $12,160 |
| 2014 | $22 | $13,040 | $2,480 | $10,560 |
Source: Public Records
Map
Nearby Homes
- 482 Tarragon Way SW
- 4039 Codel St SW
- 321 Tarragon Way SW
- 305 Fennel Way SW
- 273 Fennel Way SW
- 4015 Bakers Ferry Rd SW
- 259 Tarragon Way SW
- 0 Boulder Park Dr Unit 13974664
- 3927 Boulder Park Dr SW
- 4010 Boulder Park Dr SW
- 7098 Chara Ln SW
- 3877 Bakers Ferry
- 310 Flagstone Dr SW
- 4142 Woodland Park Dr SW
- 3763 Boulder Park Dr SW
- 3735 Boulder Park Dr SW
- 3833 Bakers Ferry Rd SW
- 3790 Brook Way SW
- 3961 Cornell Blvd SW
- 3911 Cornell Blvd SW
- 420 Fennel Way SW
- 3926 Basil Way SW
- 0 Basil Way SW Unit 7195498
- 3936 Basil Way SW
- 3916 Basil Way SW
- 430 Fennel Way SW
- 415 Fennel Way SW
- 417 Tarragon Way SW
- 429 Fennel Way SW
- 407 Fennel Way SW Unit 2
- 436 Fennel Way SW
- 403 Tarragon Way SW
- 401 Fennel Way SW
- 425 Tarragon Way SW
- 3925 Basil Way SW
- 3915 Basil Way SW
- 437 Fennel Way SW Unit 2
- 3931 Basil Way SW Unit 2
- 3937 Basil Way SW
- 393 Fennel Way SW