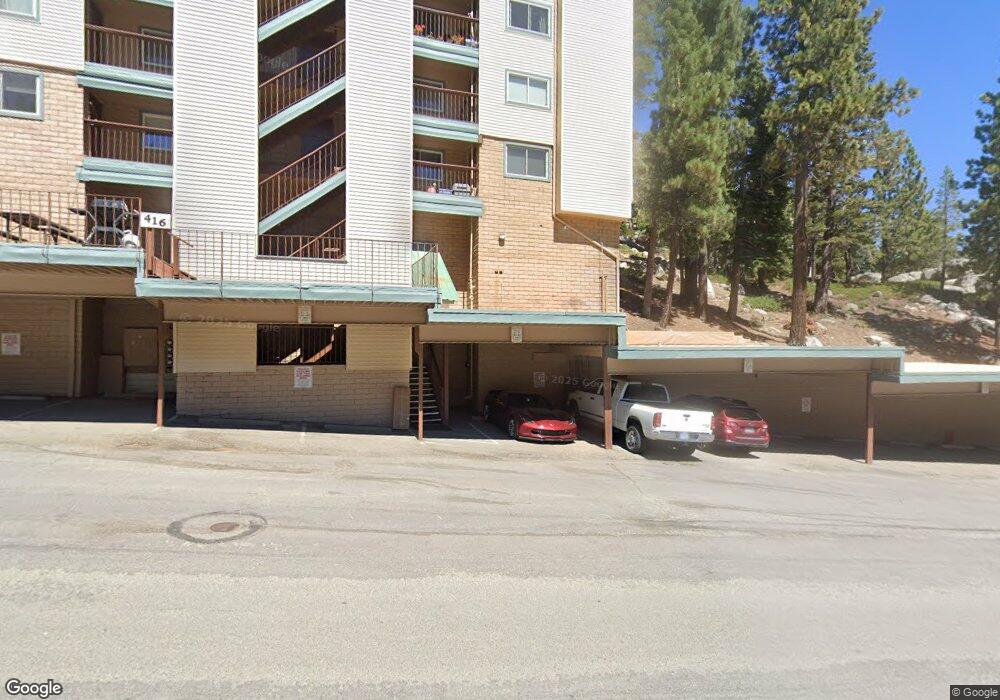
416 K Quaking Aspen Ln Stateline, NV 89449
Estimated Value: $487,000 - $631,000
--
Bed
4
Baths
890
Sq Ft
$623/Sq Ft
Est. Value
About This Home
This home is located at 416 K Quaking Aspen Ln, Stateline, NV 89449 and is currently estimated at $554,475, approximately $623 per square foot. 416 K Quaking Aspen Ln is a home located in Douglas County with nearby schools including Gene Scarselli Elementary School, Pau Wa Lu Middle School, and Douglas County High School.
Ownership History
Date
Name
Owned For
Owner Type
Purchase Details
Closed on
Apr 16, 2024
Sold by
Miller Family Trust and Miller Raymond O
Bought by
Betts Erin Shanti and Liv Alexis
Current Estimated Value
Home Financials for this Owner
Home Financials are based on the most recent Mortgage that was taken out on this home.
Original Mortgage
$376,000
Outstanding Balance
$370,382
Interest Rate
6.88%
Mortgage Type
New Conventional
Estimated Equity
$184,093
Purchase Details
Closed on
Jan 26, 2007
Sold by
Miller Raymond O
Bought by
Miller Raymond Owen
Home Financials for this Owner
Home Financials are based on the most recent Mortgage that was taken out on this home.
Original Mortgage
$254,000
Interest Rate
6.1%
Mortgage Type
New Conventional
Purchase Details
Closed on
Apr 29, 2005
Sold by
Miller Raymond O
Bought by
Miller Raymond O and Miller Family Trust
Create a Home Valuation Report for This Property
The Home Valuation Report is an in-depth analysis detailing your home's value as well as a comparison with similar homes in the area
Home Values in the Area
Average Home Value in this Area
Purchase History
| Date | Buyer | Sale Price | Title Company |
|---|---|---|---|
| Betts Erin Shanti | $470,000 | First Centennial Title | |
| Miller Raymond Owen | -- | Western Title Company Inc | |
| Miller Raymond O | -- | None Available |
Source: Public Records
Mortgage History
| Date | Status | Borrower | Loan Amount |
|---|---|---|---|
| Open | Betts Erin Shanti | $376,000 | |
| Previous Owner | Miller Raymond Owen | $254,000 |
Source: Public Records
Tax History Compared to Growth
Tax History
| Year | Tax Paid | Tax Assessment Tax Assessment Total Assessment is a certain percentage of the fair market value that is determined by local assessors to be the total taxable value of land and additions on the property. | Land | Improvement |
|---|---|---|---|---|
| 2025 | $2,431 | $91,047 | $66,500 | $24,547 |
| 2024 | $2,267 | $92,333 | $66,500 | $25,833 |
| 2023 | $2,267 | $89,739 | $66,500 | $23,239 |
| 2022 | $2,086 | $84,265 | $61,250 | $23,015 |
| 2021 | $1,932 | $78,633 | $56,000 | $22,633 |
| 2020 | $1,870 | $78,504 | $56,000 | $22,504 |
| 2019 | $1,804 | $74,627 | $51,975 | $22,652 |
| 2018 | $1,721 | $69,727 | $47,250 | $22,477 |
| 2017 | $1,653 | $69,969 | $47,250 | $22,719 |
| 2016 | $1,611 | $69,267 | $45,500 | $23,767 |
| 2015 | $1,609 | $69,267 | $45,500 | $23,767 |
| 2014 | $1,557 | $64,416 | $42,000 | $22,416 |
Source: Public Records
Map
Nearby Homes
- 416 Quaking Aspen Ln Unit P
- 383 Tramway Dr Unit B
- 363 Tramway Dr
- 771 N Bowl Unit B
- 761 Milky Way Ct Unit 1
- 758 Milky Way Ct Unit H
- 331 Tramway Dr Unit 9
- 331 Tramway Dr Unit 11
- 331 Tramway Dr Unit 4
- 331 Tramway Dr Unit 13
- 331 Tramway Dr Unit 10
- 356 Galaxy Ln Unit B
- 323 Tramway Dr Unit 301
- 323 Tramway Dr Unit 407
- 323 Tramway Dr Unit 306
- 323 Tramway Dr Unit 308
- 323 Tramway Dr Unit 202
- 323 Tramway Dr Unit 207
- 305 Galaxy Ln Unit 7
- 305 Galaxy Ln Unit 6
- 416 Quaking Aspen Ln
- 416-O Quaking Aspen
- 416 M Quaking Aspen
- 416 Quaking Aspen Ln
- 416 Quaking Aspen Ln Unit O
- 416 Quaking Aspen Ln Unit K
- 416 K Quaking Aspen Ln Unit K
- 416 Quaking Aspen Ln Unit B
- 416-O Quaking Aspen Unit O
- 416 M Quaking Aspen Unit M
- 416 Quaking Aspen Ln Unit F
- 416 Quaking Aspen Ln Unit M
- 416 Quaking Aspen Ln Unit 16 (P)
- 416 Quaking Aspen Ln Unit H
- 416 Quaking Aspen Ln Unit C
- 416 Quaking Aspen Ln Unit H
- 416 Quaking Aspen Ln Unit 1
- 416 Quaking Aspen Ln Unit E
- 416 Quaking Aspen Ln Unit I
- 416 Quaking Aspen Ln Unit J