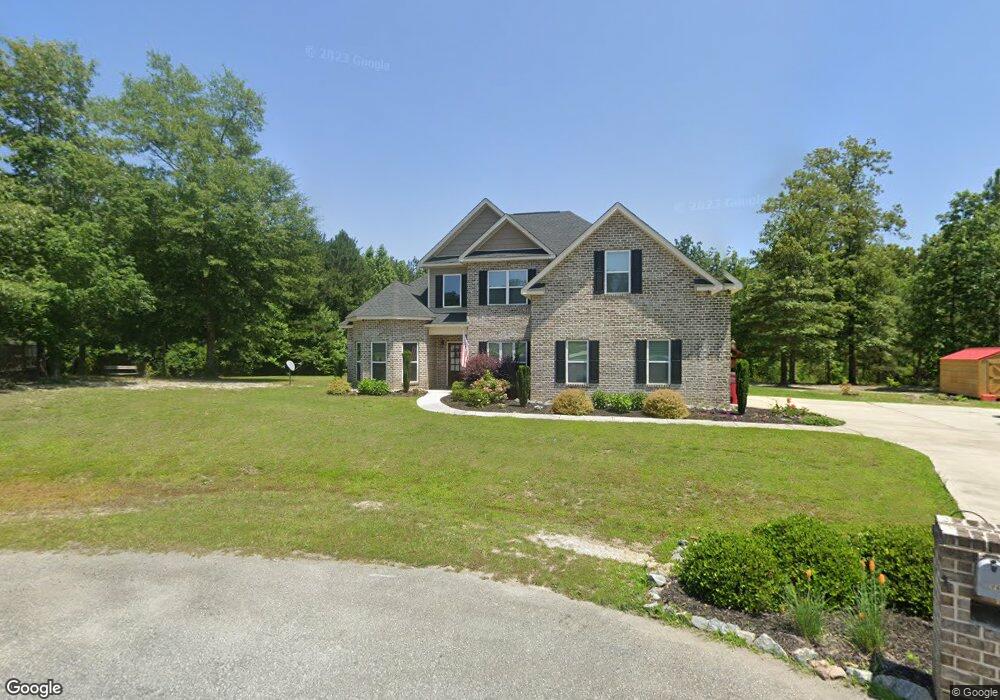
416 Kenna Way Unit 27 Lizella, GA 31052
Estimated Value: $386,000 - $395,000
5
Beds
3
Baths
2,484
Sq Ft
$157/Sq Ft
Est. Value
About This Home
This home is located at 416 Kenna Way Unit 27, Lizella, GA 31052 and is currently estimated at $390,189, approximately $157 per square foot. 416 Kenna Way Unit 27 is a home located in Bibb County with nearby schools including Skyview Elementary School, Rutland Middle School, and Rutland High School.
Ownership History
Date
Name
Owned For
Owner Type
Purchase Details
Closed on
Aug 26, 2025
Sold by
Carlisle Travis Wade and Carlisle Kristina
Bought by
Callaway Kalyn and Callaway Caleb
Current Estimated Value
Home Financials for this Owner
Home Financials are based on the most recent Mortgage that was taken out on this home.
Original Mortgage
$318,937
Outstanding Balance
$318,937
Interest Rate
6.75%
Mortgage Type
VA
Estimated Equity
$71,252
Purchase Details
Closed on
Jul 7, 2022
Sold by
Andrew Welch Michael
Bought by
Carlisle Travis Wade and Carlisle Kristina
Home Financials for this Owner
Home Financials are based on the most recent Mortgage that was taken out on this home.
Original Mortgage
$336,990
Interest Rate
5.09%
Mortgage Type
New Conventional
Purchase Details
Closed on
Mar 13, 2018
Sold by
Project Development & Management Llc
Bought by
Welch Michael Andrew
Home Financials for this Owner
Home Financials are based on the most recent Mortgage that was taken out on this home.
Original Mortgage
$234,842
Interest Rate
4.32%
Mortgage Type
VA
Purchase Details
Closed on
Sep 29, 2015
Sold by
Colony Bank
Bought by
Project Developement & Mgmt
Purchase Details
Closed on
Apr 8, 2010
Sold by
Martin Owen and Mcelmurray Kenneth W
Bought by
Colony Bank
Create a Home Valuation Report for This Property
The Home Valuation Report is an in-depth analysis detailing your home's value as well as a comparison with similar homes in the area
Home Values in the Area
Average Home Value in this Area
Purchase History
| Date | Buyer | Sale Price | Title Company |
|---|---|---|---|
| Callaway Kalyn | $385,000 | None Listed On Document | |
| Carlisle Travis Wade | $337,000 | None Listed On Document | |
| Welch Michael Andrew | $229,900 | None Available | |
| Project Developement & Mgmt | $140,500 | -- | |
| Colony Bank | $860,000 | -- |
Source: Public Records
Mortgage History
| Date | Status | Borrower | Loan Amount |
|---|---|---|---|
| Open | Callaway Kalyn | $318,937 | |
| Previous Owner | Carlisle Travis Wade | $336,990 | |
| Previous Owner | Welch Michael Andrew | $234,842 |
Source: Public Records
Tax History Compared to Growth
Tax History
| Year | Tax Paid | Tax Assessment Tax Assessment Total Assessment is a certain percentage of the fair market value that is determined by local assessors to be the total taxable value of land and additions on the property. | Land | Improvement |
|---|---|---|---|---|
| 2025 | $301 | $134,059 | $15,312 | $118,747 |
| 2024 | $433 | $134,059 | $15,312 | $118,747 |
| 2023 | $3,405 | $134,059 | $15,312 | $118,747 |
| 2022 | $3,676 | $106,182 | $12,030 | $94,152 |
| 2021 | $3,762 | $99,010 | $10,742 | $88,268 |
| 2020 | $3,844 | $99,010 | $10,742 | $88,268 |
| 2019 | $3,600 | $103,290 | $10,742 | $92,548 |
| 2018 | $3,611 | $57,232 | $3,760 | $53,472 |
| 2017 | $141 | $3,760 | $3,760 | $0 |
| 2016 | $155 | $4,466 | $4,466 | $0 |
| 2015 | $219 | $4,466 | $4,466 | $0 |
| 2014 | -- | $4,466 | $4,466 | $0 |
Source: Public Records
Map
Nearby Homes
- 5771 Rogers Rd
- 177 Doublegate Dr
- 173 Doublegate Dr
- 169 Doublegate Dr
- 132 Hidden Creek Cir
- 6219 Clayts Cir
- 218 Jason Way
- 6100 Clayts Cir
- 306 Jason Ct
- 5002 Fulton Mill Rd
- 5397 Mount Pleasant Church Rd Unit Parcel 1
- 5845 Mount Pleasant Church Rd
- 5385 Mount Pleasant Church Rd Unit Parcel 3
- 148 Marcar Rd
- 228 Welsh Trail Unit Lot 6
- 228 Welsh Trail Unit LOT 17
- 228 Welsh Trail
- 220 Welsh Trail Unit LOT 3
- 220 Welsh Trail
- 227 Welsh Trl Lot #6 Trail Unit Lot 6
- 410 Kenna Way
- 410 Kenna Way Unit 28
- 406 Kenna Way
- 406 Kenna Way Unit 29
- 409 Kenna Way
- 409 Kenna Way Unit 26
- 402 Kenna Way
- 402 Kenna Way Unit 402
- 402 Kenna Way Unit 30
- 227 Wesley Joe Ct
- 227 Wesley Joe Ct Unit 31
- 209 Kenna Way
- 405 Kenna Way
- 405 Kenna Way Unit 25
- 5789 Rogers Rd
- 5797 Rogers Rd
- 217 Wesley Joe Ct Unit 24
- 217 Wesley Joe Ct
- 226 Wesley Joe Ct Unit 32
- 226 Wesley Joe Ct