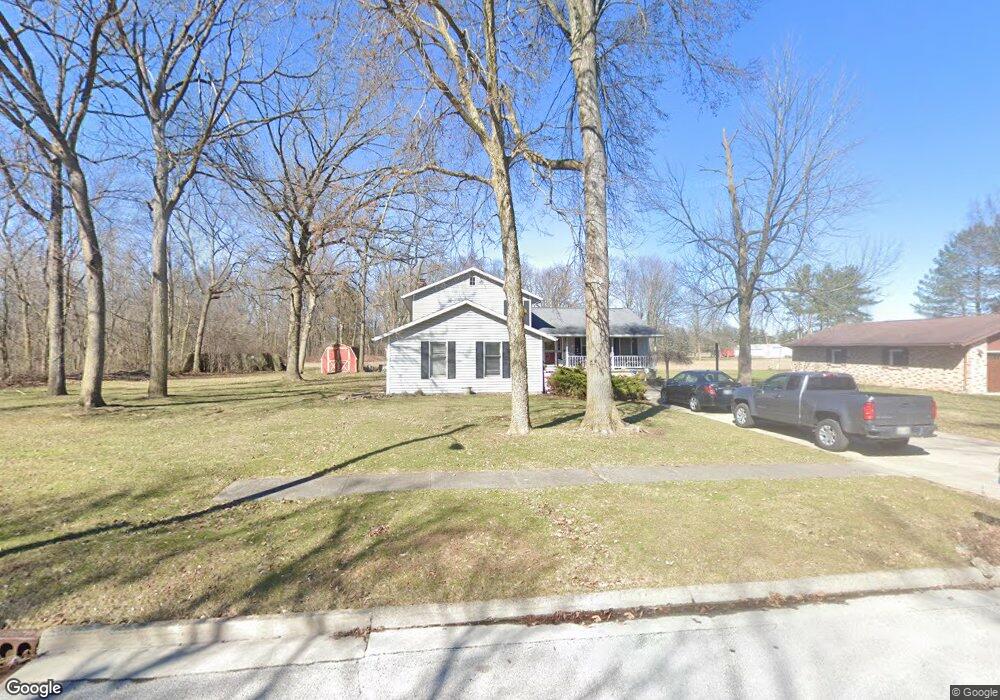
416 Kennison Dr Findlay, OH 45840
Estimated Value: $249,000 - $343,000
3
Beds
3
Baths
2,416
Sq Ft
$129/Sq Ft
Est. Value
About This Home
This home is located at 416 Kennison Dr, Findlay, OH 45840 and is currently estimated at $312,443, approximately $129 per square foot. 416 Kennison Dr is a home located in Hancock County with nearby schools including Chamberlin Hill Elementary School, Jefferson Elementary School, and Donnell Middle School.
Ownership History
Date
Name
Owned For
Owner Type
Purchase Details
Closed on
Dec 5, 2007
Sold by
Primacy Closing Corp and Boswell Ross A
Bought by
Huff Brian K and Huff Stephanie M
Current Estimated Value
Home Financials for this Owner
Home Financials are based on the most recent Mortgage that was taken out on this home.
Original Mortgage
$147,925
Outstanding Balance
$93,679
Interest Rate
6.31%
Mortgage Type
Purchase Money Mortgage
Estimated Equity
$218,764
Purchase Details
Closed on
Feb 5, 2007
Sold by
Messenger Timothy T and Messenger Gloria G
Bought by
Primacy Closing Corp
Purchase Details
Closed on
May 25, 1995
Sold by
Inbody Steven
Bought by
Messenger Timothy and Messenger Gloria
Home Financials for this Owner
Home Financials are based on the most recent Mortgage that was taken out on this home.
Original Mortgage
$112,000
Interest Rate
8.4%
Mortgage Type
New Conventional
Create a Home Valuation Report for This Property
The Home Valuation Report is an in-depth analysis detailing your home's value as well as a comparison with similar homes in the area
Home Values in the Area
Average Home Value in this Area
Purchase History
| Date | Buyer | Sale Price | Title Company |
|---|---|---|---|
| Huff Brian K | $152,500 | Mid Am Title | |
| Primacy Closing Corp | $170,500 | Mid Am Title | |
| Messenger Timothy | $153,500 | -- |
Source: Public Records
Mortgage History
| Date | Status | Borrower | Loan Amount |
|---|---|---|---|
| Open | Huff Brian K | $147,925 | |
| Previous Owner | Messenger Timothy | $112,000 |
Source: Public Records
Tax History Compared to Growth
Tax History
| Year | Tax Paid | Tax Assessment Tax Assessment Total Assessment is a certain percentage of the fair market value that is determined by local assessors to be the total taxable value of land and additions on the property. | Land | Improvement |
|---|---|---|---|---|
| 2024 | $2,999 | $84,400 | $11,420 | $72,980 |
| 2023 | $3,003 | $84,400 | $11,420 | $72,980 |
| 2022 | $2,993 | $84,400 | $11,420 | $72,980 |
| 2021 | $2,994 | $69,730 | $11,410 | $58,320 |
| 2020 | $2,838 | $69,730 | $11,410 | $58,320 |
| 2019 | $2,797 | $69,730 | $11,410 | $58,320 |
| 2018 | $2,637 | $60,640 | $9,930 | $50,710 |
| 2017 | $1,318 | $60,640 | $9,930 | $50,710 |
| 2016 | $2,596 | $60,640 | $9,930 | $50,710 |
| 2015 | $2,552 | $58,370 | $9,930 | $48,440 |
| 2014 | $2,570 | $58,370 | $9,930 | $48,440 |
| 2012 | $2,572 | $58,370 | $9,930 | $48,440 |
Source: Public Records
Map
Nearby Homes
- 0 Penrose Dr
- 3323 Western Ave
- 0 Township Road 77
- 3065 S Main St
- 0 Virbunum Ct Unit 87 305267
- 0 Viburnum Ct Unit 20243687
- 0 Viburnum Ct Unit 6121366
- 500 Blue Bonnet Dr
- 164 Church Hill Dr
- 128 Church Hill Dr
- 2010 S Main St
- 0 Township Road 227
- 1421 Hurd Ave
- 1818 Westview Dr
- 11787 County Road 180
- 1609 Foraker Ave
- 0 Park St Lot 6
- 0 Park St Lot 5
- 0 Park St Lot 4
- 0 Park St Lot 3
- 500 Kennison Dr
- 408 Kennison Dr
- 3315 Penrose Dr
- 415 Kennison Dr
- 501 Kennison Dr
- 3320 Springlake Dr
- 511 Kennison Dr
- 3400 Springlake Dr
- 420 Kirk Dr
- 414 Kirk Dr
- 3320 Penrose Dr
- 3325 Penrose Dr
- 500 Kirk Dr
- 408 Kirk Dr
- 3414 Springlake Dr
- 3324 Penrose Dr
- 508 Kirk Dr
- 3329 Penrose Dr
- 3420 Springlake Dr
- 11750 State Route 68