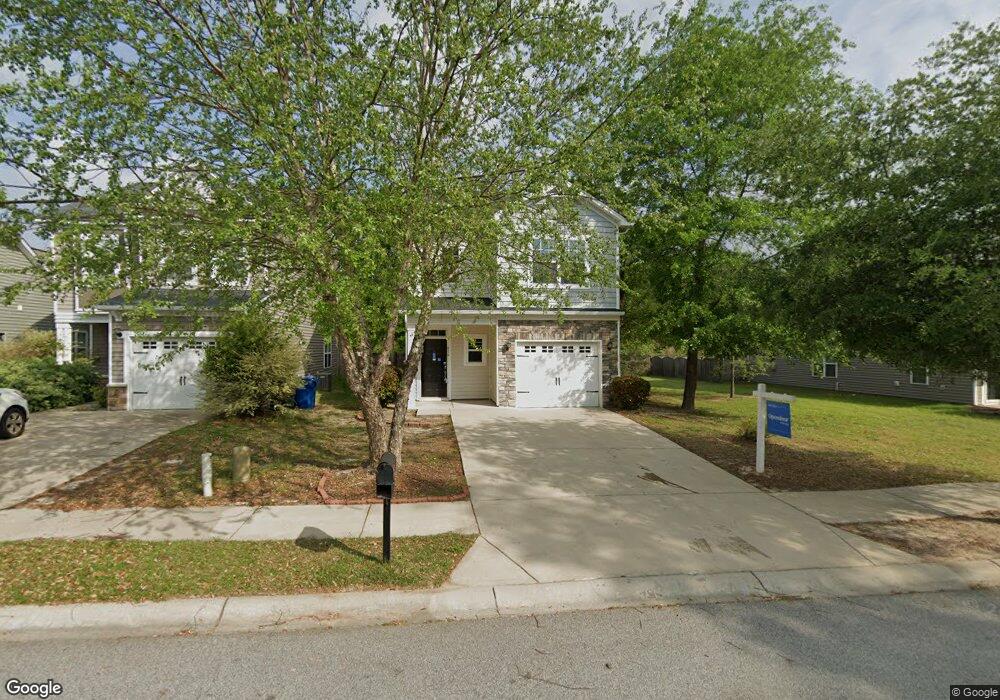
416 Laurel Leaf Dr West Columbia, SC 29169
Estimated Value: $250,000 - $293,000
3
Beds
3
Baths
1,699
Sq Ft
$160/Sq Ft
Est. Value
About This Home
This home is located at 416 Laurel Leaf Dr, West Columbia, SC 29169 and is currently estimated at $271,834, approximately $159 per square foot. 416 Laurel Leaf Dr is a home located in Lexington County with nearby schools including Riverbank Elementary, Northside Middle, and Brookland-Cayce High School.
Ownership History
Date
Name
Owned For
Owner Type
Purchase Details
Closed on
Apr 18, 2023
Sold by
Opendoor Property Trust
Bought by
Robbins Adam
Current Estimated Value
Home Financials for this Owner
Home Financials are based on the most recent Mortgage that was taken out on this home.
Original Mortgage
$257,000
Outstanding Balance
$250,026
Interest Rate
6.73%
Mortgage Type
VA
Estimated Equity
$21,808
Purchase Details
Closed on
Jan 27, 2023
Sold by
Merchant Curtis E
Bought by
Opendoor Property Trust
Purchase Details
Closed on
Oct 22, 2012
Sold by
Mungo Homes Inc
Bought by
Merchant Curtis E and Merchant Latashawinn J
Home Financials for this Owner
Home Financials are based on the most recent Mortgage that was taken out on this home.
Original Mortgage
$126,473
Interest Rate
3.53%
Mortgage Type
Future Advance Clause Open End Mortgage
Create a Home Valuation Report for This Property
The Home Valuation Report is an in-depth analysis detailing your home's value as well as a comparison with similar homes in the area
Home Values in the Area
Average Home Value in this Area
Purchase History
| Date | Buyer | Sale Price | Title Company |
|---|---|---|---|
| Robbins Adam | $257,000 | None Listed On Document | |
| Opendoor Property Trust | $206,100 | -- | |
| Merchant Curtis E | $126,473 | -- |
Source: Public Records
Mortgage History
| Date | Status | Borrower | Loan Amount |
|---|---|---|---|
| Open | Robbins Adam | $257,000 | |
| Previous Owner | Merchant Curtis E | $126,473 |
Source: Public Records
Tax History Compared to Growth
Tax History
| Year | Tax Paid | Tax Assessment Tax Assessment Total Assessment is a certain percentage of the fair market value that is determined by local assessors to be the total taxable value of land and additions on the property. | Land | Improvement |
|---|---|---|---|---|
| 2024 | $1,965 | $10,280 | $1,400 | $8,880 |
| 2023 | $1,965 | $5,502 | $1,000 | $4,502 |
| 2022 | $1,061 | $5,502 | $1,000 | $4,502 |
| 2020 | $1,019 | $5,502 | $1,000 | $4,502 |
| 2019 | $957 | $5,060 | $1,000 | $4,060 |
| 2018 | $967 | $5,060 | $1,000 | $4,060 |
| 2017 | $928 | $5,060 | $1,000 | $4,060 |
| 2016 | $954 | $5,060 | $1,000 | $4,060 |
| 2014 | $726 | $5,058 | $800 | $4,258 |
| 2013 | -- | $5,060 | $800 | $4,260 |
Source: Public Records
Map
Nearby Homes
- 629 Spanish Oak Dr
- 700 Blackjack Ct
- 161 Weeping Oak Ln
- 144 Wainscot Oak Ln
- 178 Quinton Ct
- 108 Harvest Glen Ln
- 913 Harper Rose Ct
- 179 War Admiral Dr
- 500 Finnegan Ln
- 328 Brookland Way
- 0 Sunset Blvd Unit 553428
- 713 Winged Seed Rd
- 914 Hook Ave
- 2720 Hebron Dr
- 292 Marabou Cir
- 438 Pinaster Path
- 416 Pinaster Path
- 0 Mathias Rd Unit 592129
- 0 Mathias Rd Unit 511650
- 420 Pinaster Path
- 420 Laurel Leaf Dr
- 412 Laurel Leaf Dr
- 424 Laurel Leaf Dr
- 408 Laurel Leaf Dr
- 428 Laurel Leaf Dr
- 404 Laurel Leaf Dr
- 432 Laurel Leaf Dr
- 413 Laurel Leaf Dr
- 421 Laurel Leaf Dr
- 417 Laurel Leaf Dr
- 429 Laurel Leaf Dr
- 425 Laurel Leaf Dr
- 409 Laurel Leaf Dr
- 400 Laurel Leaf Dr
- 433 Laurel Leaf Dr
- 405 Laurel Leaf Dr
- 437 Laurel Leaf Dr
- 436 Laurel Leaf Dr
- 441 Laurel Leaf Dr
- 616 Spanish Oak Dr