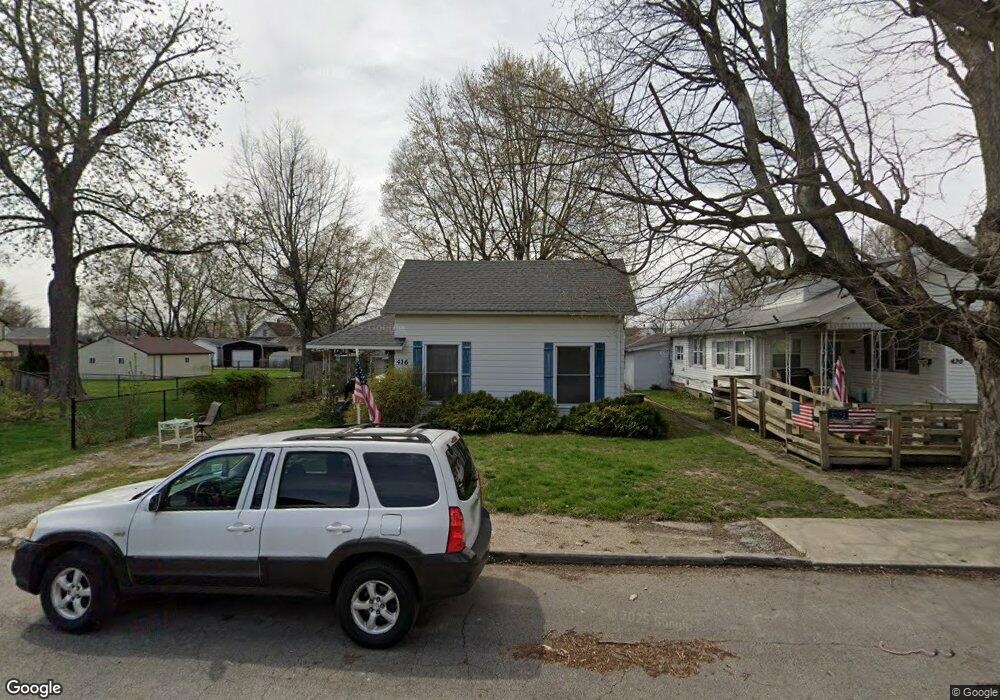
416 N 11th St Elwood, IN 46036
Estimated Value: $90,000 - $129,000
2
Beds
1
Bath
932
Sq Ft
$118/Sq Ft
Est. Value
About This Home
This home is located at 416 N 11th St, Elwood, IN 46036 and is currently estimated at $110,135, approximately $118 per square foot. 416 N 11th St is a home located in Madison County with nearby schools including Elwood Elementary School, Elwood Intermediate School, and Elwood Junior-Senior High School.
Ownership History
Date
Name
Owned For
Owner Type
Purchase Details
Closed on
Mar 2, 2011
Sold by
Secretary Of Hud
Bought by
Runyan Pam
Current Estimated Value
Purchase Details
Closed on
Dec 28, 2007
Sold by
Reo Nationwide Llc
Bought by
Hanrahan Candace M
Home Financials for this Owner
Home Financials are based on the most recent Mortgage that was taken out on this home.
Original Mortgage
$38,594
Interest Rate
6.31%
Mortgage Type
FHA
Purchase Details
Closed on
Jul 11, 2007
Sold by
Deutsche Bank National Trust Co
Bought by
Reo Nationwide Llc
Purchase Details
Closed on
Sep 15, 2006
Sold by
Werline Danny J and Werline Brandi D
Bought by
Deutsch Bank National Trust Co
Create a Home Valuation Report for This Property
The Home Valuation Report is an in-depth analysis detailing your home's value as well as a comparison with similar homes in the area
Home Values in the Area
Average Home Value in this Area
Purchase History
| Date | Buyer | Sale Price | Title Company |
|---|---|---|---|
| Runyan Pam | -- | -- | |
| Hanrahan Candace M | -- | -- | |
| Reo Nationwide Llc | -- | -- | |
| Deutsch Bank National Trust Co | $63,000 | -- |
Source: Public Records
Mortgage History
| Date | Status | Borrower | Loan Amount |
|---|---|---|---|
| Previous Owner | Hanrahan Candace M | $38,594 |
Source: Public Records
Tax History Compared to Growth
Tax History
| Year | Tax Paid | Tax Assessment Tax Assessment Total Assessment is a certain percentage of the fair market value that is determined by local assessors to be the total taxable value of land and additions on the property. | Land | Improvement |
|---|---|---|---|---|
| 2025 | $992 | $49,600 | $13,700 | $35,900 |
| 2024 | $992 | $49,600 | $13,700 | $35,900 |
| 2023 | $457 | $45,700 | $13,000 | $32,700 |
| 2022 | $460 | $45,000 | $12,300 | $32,700 |
| 2021 | $423 | $42,300 | $12,300 | $30,000 |
| 2020 | $413 | $40,300 | $11,700 | $28,600 |
| 2019 | $405 | $39,500 | $11,700 | $27,800 |
| 2018 | $386 | $37,600 | $11,700 | $25,900 |
| 2017 | $372 | $37,200 | $11,700 | $25,500 |
| 2016 | $445 | $43,500 | $11,700 | $31,800 |
| 2014 | $431 | $43,100 | $11,700 | $31,400 |
| 2013 | $431 | $43,100 | $11,700 | $31,400 |
Source: Public Records
Map
Nearby Homes