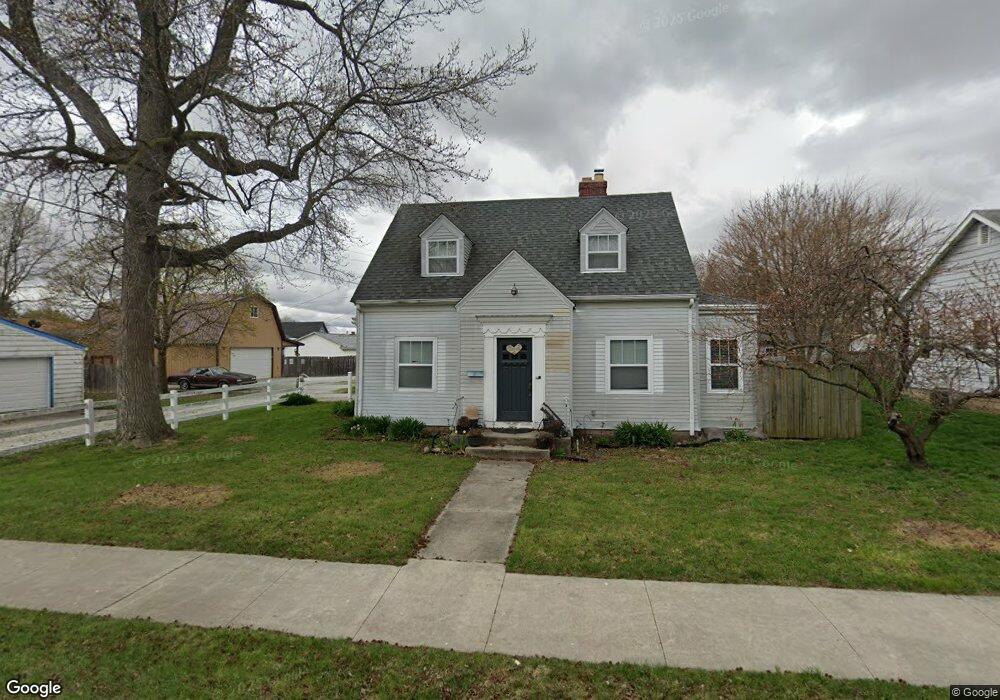
416 N 19th St Elwood, IN 46036
Estimated Value: $167,000 - $180,000
3
Beds
1
Bath
1,650
Sq Ft
$106/Sq Ft
Est. Value
About This Home
This home is located at 416 N 19th St, Elwood, IN 46036 and is currently estimated at $175,452, approximately $106 per square foot. 416 N 19th St is a home located in Madison County with nearby schools including Elwood Elementary School, Elwood Intermediate School, and Elwood Junior-Senior High School.
Ownership History
Date
Name
Owned For
Owner Type
Purchase Details
Closed on
Aug 6, 2021
Sold by
Dick Haley
Bought by
Whitacre Julie Ann
Current Estimated Value
Home Financials for this Owner
Home Financials are based on the most recent Mortgage that was taken out on this home.
Original Mortgage
$102,400
Outstanding Balance
$92,710
Interest Rate
2.9%
Mortgage Type
New Conventional
Estimated Equity
$82,742
Purchase Details
Closed on
Dec 8, 2017
Sold by
Howard Max
Bought by
Mccotry Asia
Purchase Details
Closed on
Jun 30, 2017
Purchase Details
Closed on
Jun 8, 2017
Sold by
Mitchell Debra Conwell
Bought by
Cooper Sheila A
Purchase Details
Closed on
May 3, 2011
Sold by
Secretary Of Hud Of Dc
Bought by
Shane Conwell Sole Proprietor
Purchase Details
Closed on
Jan 18, 2011
Sold by
Gmac Mortgage Llc
Bought by
Secretary Of Hud
Purchase Details
Closed on
Oct 3, 2008
Sold by
Henry Jeremy Joe and Farrer Bingham
Bought by
Gmac Mortgage Llc
Create a Home Valuation Report for This Property
The Home Valuation Report is an in-depth analysis detailing your home's value as well as a comparison with similar homes in the area
Home Values in the Area
Average Home Value in this Area
Purchase History
| Date | Buyer | Sale Price | Title Company |
|---|---|---|---|
| Whitacre Julie Ann | $256,000 | Fidelity National Title | |
| Mccotry Asia | -- | -- | |
| -- | -- | -- | |
| Cooper Sheila A | $10,000 | -- | |
| Shane Conwell Sole Proprietor | -- | -- | |
| Secretary Of Hud | -- | -- | |
| Gmac Mortgage Llc | $89,744 | -- |
Source: Public Records
Mortgage History
| Date | Status | Borrower | Loan Amount |
|---|---|---|---|
| Open | Whitacre Julie Ann | $102,400 |
Source: Public Records
Tax History Compared to Growth
Tax History
| Year | Tax Paid | Tax Assessment Tax Assessment Total Assessment is a certain percentage of the fair market value that is determined by local assessors to be the total taxable value of land and additions on the property. | Land | Improvement |
|---|---|---|---|---|
| 2025 | $720 | $72,000 | $12,800 | $59,200 |
| 2024 | $720 | $72,000 | $12,800 | $59,200 |
| 2023 | $658 | $65,800 | $12,100 | $53,700 |
| 2022 | $660 | $65,000 | $11,300 | $53,700 |
| 2021 | $591 | $59,100 | $11,000 | $48,100 |
| 2020 | $560 | $54,500 | $10,200 | $44,300 |
| 2019 | $547 | $53,200 | $10,200 | $43,000 |
| 2018 | $522 | $50,700 | $10,200 | $40,500 |
| 2017 | $524 | $52,400 | $6,400 | $46,000 |
| 2016 | $1,014 | $50,200 | $6,200 | $44,000 |
| 2014 | $1,026 | $51,300 | $6,400 | $44,900 |
| 2013 | $1,026 | $51,300 | $6,400 | $44,900 |
Source: Public Records
Map
Nearby Homes