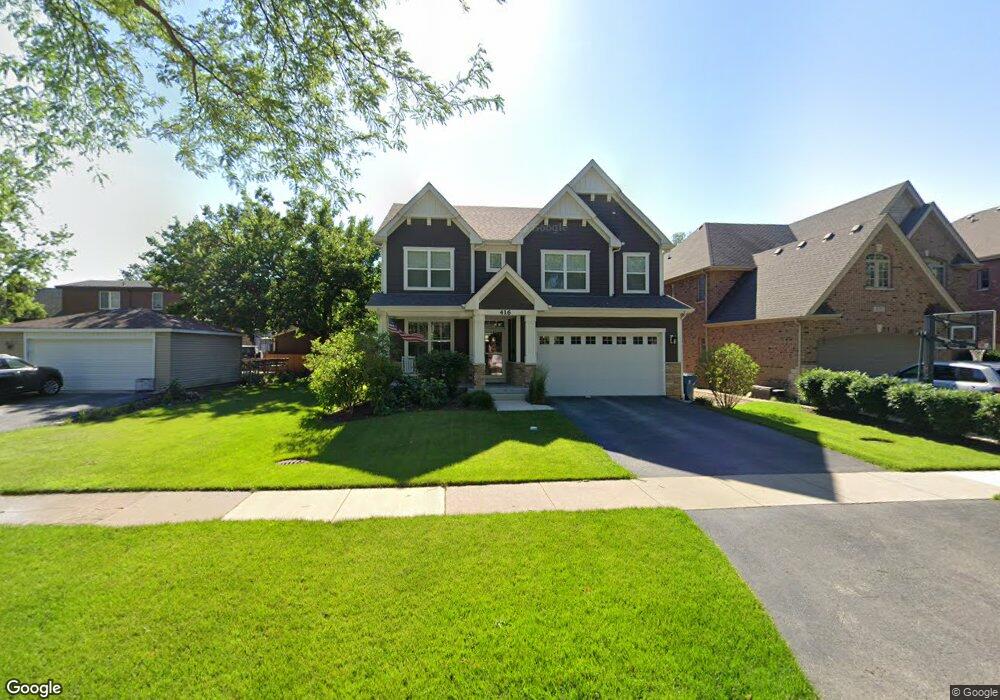
416 N Maple Ave Elmhurst, IL 60126
Estimated Value: $1,154,000 - $1,357,000
4
Beds
4
Baths
3,277
Sq Ft
$386/Sq Ft
Est. Value
About This Home
This home is located at 416 N Maple Ave, Elmhurst, IL 60126 and is currently estimated at $1,266,208, approximately $386 per square foot. 416 N Maple Ave is a home located in DuPage County with nearby schools including Emerson Elementary School, Churchville Middle School, and York Community High School.
Ownership History
Date
Name
Owned For
Owner Type
Purchase Details
Closed on
Jan 13, 2025
Sold by
Andersen Scott and Andersen Stephanie
Bought by
Scott And Stephanie Andersen Revocable Trust and Andersen
Current Estimated Value
Purchase Details
Closed on
May 15, 2017
Sold by
Drh Cambridge Homes Inc
Bought by
Andersen Scott and Andersen Stephanie
Home Financials for this Owner
Home Financials are based on the most recent Mortgage that was taken out on this home.
Original Mortgage
$660,720
Interest Rate
3.75%
Mortgage Type
New Conventional
Purchase Details
Closed on
Dec 9, 2015
Sold by
Marquette Bank
Bought by
Drh Cambridge Homes Inc
Purchase Details
Closed on
Jul 27, 2011
Sold by
Marquette Bank
Bought by
Marquette Bank
Purchase Details
Closed on
Dec 5, 2008
Sold by
Cook Stanley G and Cook Marjorie I
Bought by
Marquette Bank Trust #5251 and Trust #5251
Purchase Details
Closed on
Jan 18, 1994
Sold by
Cook Stanley G and Cook Marjorie I
Bought by
Cook Stanley G and Cook Marjorie I
Create a Home Valuation Report for This Property
The Home Valuation Report is an in-depth analysis detailing your home's value as well as a comparison with similar homes in the area
Home Values in the Area
Average Home Value in this Area
Purchase History
| Date | Buyer | Sale Price | Title Company |
|---|---|---|---|
| Scott And Stephanie Andersen Revocable Trust | -- | None Listed On Document | |
| Andersen Scott | $826,000 | First American Title | |
| Drh Cambridge Homes Inc | $252,500 | Chicago Title | |
| Marquette Bank | -- | None Available | |
| Marquette Bank Trust #5251 | $230,000 | First American Title | |
| Cook Stanley G | -- | -- | |
| Cook Stanley G | -- | -- |
Source: Public Records
Mortgage History
| Date | Status | Borrower | Loan Amount |
|---|---|---|---|
| Previous Owner | Andersen Scott | $660,720 |
Source: Public Records
Tax History
| Year | Tax Paid | Tax Assessment Tax Assessment Total Assessment is a certain percentage of the fair market value that is determined by local assessors to be the total taxable value of land and additions on the property. | Land | Improvement |
|---|---|---|---|---|
| 2024 | $19,943 | $333,650 | $70,816 | $262,834 |
| 2023 | $18,436 | $306,720 | $65,100 | $241,620 |
| 2022 | $16,295 | $272,020 | $62,300 | $209,720 |
| 2021 | $15,613 | $260,550 | $59,670 | $200,880 |
| 2020 | $14,703 | $249,560 | $57,150 | $192,410 |
| 2019 | $14,566 | $239,960 | $54,950 | $185,010 |
| 2018 | $13,804 | $226,410 | $52,340 | $174,070 |
| 2017 | $8,259 | $50,020 | $50,020 | $0 |
| 2016 | $4,659 | $69,420 | $46,180 | $23,240 |
| 2015 | $5,697 | $85,600 | $42,660 | $42,940 |
| 2014 | $5,032 | $70,630 | $35,200 | $35,430 |
| 2013 | $5,013 | $72,070 | $35,920 | $36,150 |
Source: Public Records
Map
Nearby Homes
- 456 N Elm Ave
- 270 W Fremont Ave
- 374 N Myrtle Ave
- 365 N Walnut St
- 557 N Myrtle Ave
- 275 W North Ave
- 367 N Oak St
- 260 N Addison Ave
- 258 N Addison Ave
- 256 N Addison Ave
- 254 N Addison Ave
- 132 E Gladys Ave
- 183 E Grantley Ave
- 322 N Highland Ave
- 210 N Addison Ave Unit 301N
- 195 N Addison Ave Unit PH03
- 468 N Highland Ave
- 432 N Ridgeland Ave
- 284 N Highland Ave
- 286 N Indiana St
- 420 N Maple Ave
- 424 N Maple Ave
- 211 W Fremont Ave
- 207 W Fremont Ave
- 428 N Maple Ave
- 215 W Fremont Ave
- 219 W Fremont Ave
- 430 N Maple Ave
- 421 N Elm Ave
- 195 W Fremont Ave
- 417 N Maple Ave
- 421 N Maple Ave
- 419 N Elm Ave
- 429 N Maple Ave
- 434 N Maple Ave
- 427 N Maple Ave
- 392 N Maple Ave
- 427 N Elm Ave
- 229 W Fremont Ave
- 191 W Fremont Ave
Your Personal Tour Guide
Ask me questions while you tour the home.