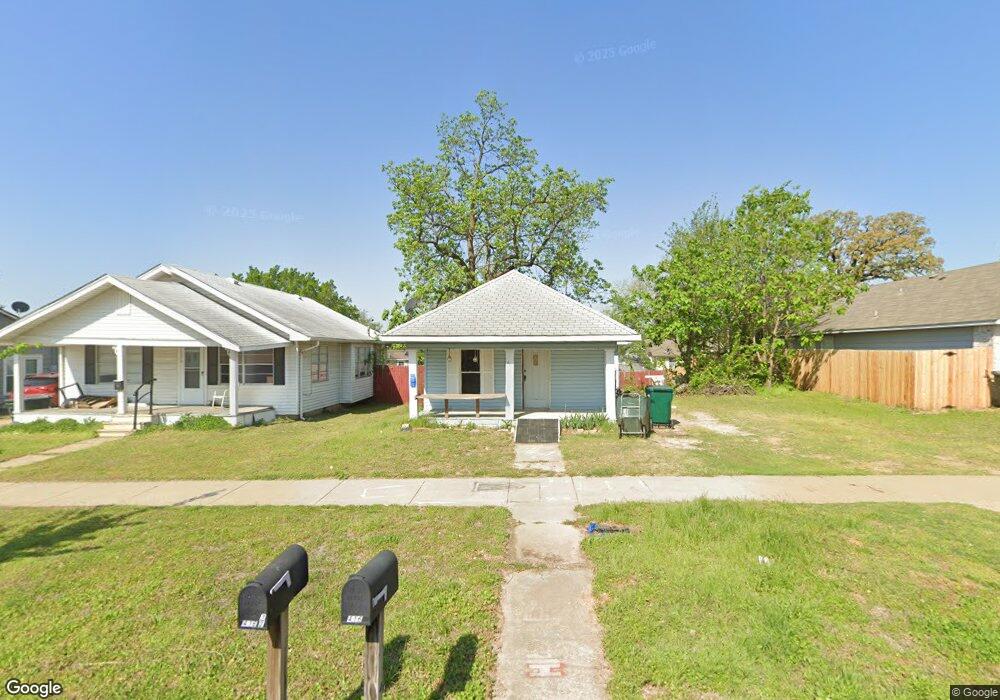
416 N Roosevelt Ave Sand Springs, OK 74063
Estimated Value: $109,000 - $144,000
1
Bed
1
Bath
656
Sq Ft
$186/Sq Ft
Est. Value
About This Home
This home is located at 416 N Roosevelt Ave, Sand Springs, OK 74063 and is currently estimated at $121,916, approximately $185 per square foot. 416 N Roosevelt Ave is a home located in Tulsa County with nearby schools including Garfield STEAM Academy, Northwoods Fine Arts Academy, and Clyde Boyd Middle School.
Ownership History
Date
Name
Owned For
Owner Type
Purchase Details
Closed on
Jan 4, 2019
Sold by
Martin Andrew W and Martin Sharon G
Bought by
Philbeck Iris A
Current Estimated Value
Home Financials for this Owner
Home Financials are based on the most recent Mortgage that was taken out on this home.
Original Mortgage
$85,000
Outstanding Balance
$74,732
Interest Rate
4.6%
Mortgage Type
New Conventional
Estimated Equity
$47,184
Purchase Details
Closed on
Nov 18, 2005
Sold by
Spinharney Steve
Bought by
Martin Andrew W and Martin Sharon G
Home Financials for this Owner
Home Financials are based on the most recent Mortgage that was taken out on this home.
Original Mortgage
$35,700
Interest Rate
6.04%
Mortgage Type
Purchase Money Mortgage
Purchase Details
Closed on
Feb 13, 2001
Sold by
Spinharney Dana
Bought by
Spinharney Steve
Create a Home Valuation Report for This Property
The Home Valuation Report is an in-depth analysis detailing your home's value as well as a comparison with similar homes in the area
Home Values in the Area
Average Home Value in this Area
Purchase History
| Date | Buyer | Sale Price | Title Company |
|---|---|---|---|
| Philbeck Iris A | $85,000 | None Available | |
| Martin Andrew W | $42,000 | -- | |
| Spinharney Steve | -- | -- |
Source: Public Records
Mortgage History
| Date | Status | Borrower | Loan Amount |
|---|---|---|---|
| Open | Philbeck Iris A | $85,000 | |
| Previous Owner | Martin Andrew W | $35,700 |
Source: Public Records
Tax History Compared to Growth
Tax History
| Year | Tax Paid | Tax Assessment Tax Assessment Total Assessment is a certain percentage of the fair market value that is determined by local assessors to be the total taxable value of land and additions on the property. | Land | Improvement |
|---|---|---|---|---|
| 2024 | $1,301 | $10,659 | $1,455 | $9,204 |
| 2023 | $1,301 | $10,309 | $1,407 | $8,902 |
| 2022 | $1,211 | $9,818 | $1,340 | $8,478 |
| 2021 | $1,173 | $9,350 | $1,276 | $8,074 |
| 2020 | $1,214 | $9,350 | $1,276 | $8,074 |
| 2019 | $583 | $4,620 | $1,276 | $3,344 |
| 2018 | $568 | $4,620 | $1,276 | $3,344 |
| 2017 | $557 | $4,620 | $1,276 | $3,344 |
| 2016 | $568 | $4,620 | $1,276 | $3,344 |
| 2015 | $576 | $4,620 | $1,276 | $3,344 |
| 2014 | $582 | $4,620 | $1,276 | $3,344 |
Source: Public Records
Map
Nearby Homes
- 411 N Roosevelt Ave
- 515 N Roosevelt Ave
- 523 N Roosevelt Ave
- 608 N Roosevelt Ave
- 610 N Garfield Ave
- 513 N Main St
- 214 N Wilson
- 306 N Grant Ave
- 4 S 265th West Ave
- 3 S 265th West Ave
- 416 N Franklin Ave
- 608 N Mckinley Ave
- 518 N Franklin Ave
- 405 N Industrial Ave
- 600 N Franklin Ave
- 307 N Industrial Ave
- 0 N Franklin Ave
- 606 W 2nd St
- 820 N Grant Ave
- 917 N Grant Ave
- 412 N Roosevelt Ave
- 410 N Roosevelt Ave
- 210 W 5th St
- 408 N Roosevelt Ave
- 413 N Cleveland Ave
- 411 N Cleveland Ave
- 500 N Roosevelt Ave
- 409 N Cleveland Ave Unit 12
- 406 N Roosevelt Ave
- 415 N Cleveland Ave
- 213 W 5th St
- 415 N Roosevelt Ave
- 413 N Roosevelt Ave
- 417 N Roosevelt Ave
- 502 N Roosevelt Ave
- 215 W 5th St
- 404 N Roosevelt Ave
- 405 N Cleveland Ave
- 409 N Roosevelt Ave
- 219 W 5th St