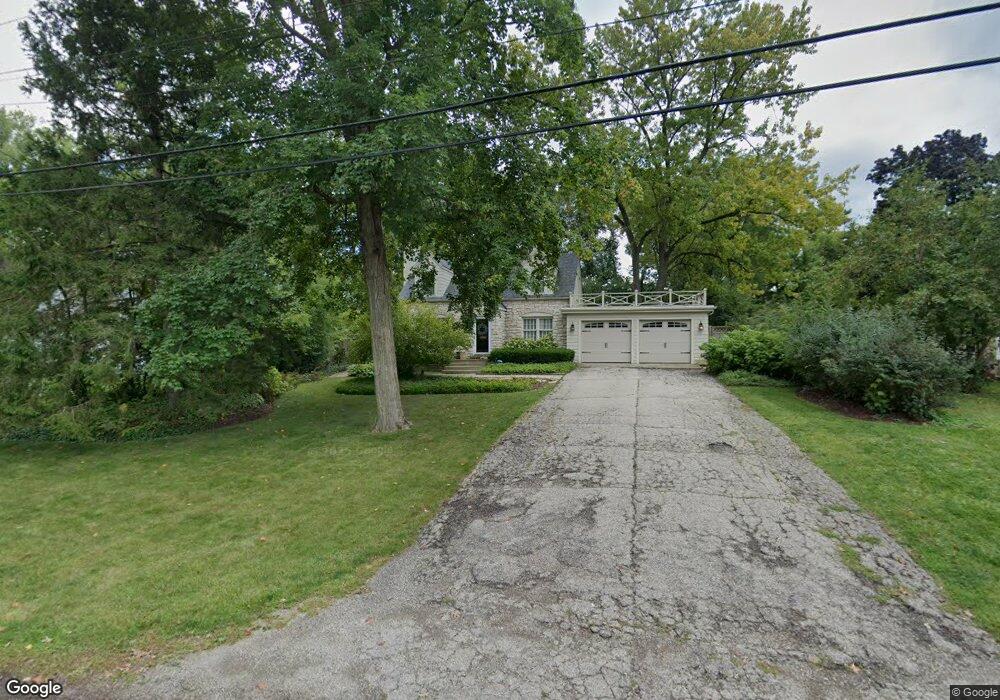
416 Oakwood Ave Woodstock, IL 60098
Estimated Value: $310,885 - $351,000
4
Beds
2
Baths
1,578
Sq Ft
$208/Sq Ft
Est. Value
About This Home
This home is located at 416 Oakwood Ave, Woodstock, IL 60098 and is currently estimated at $328,971, approximately $208 per square foot. 416 Oakwood Ave is a home located in McHenry County with nearby schools including Dean Street Elementary School, Creekside Middle School, and Woodstock High School.
Ownership History
Date
Name
Owned For
Owner Type
Purchase Details
Closed on
Dec 20, 2019
Sold by
Smith Scott C
Bought by
Smith Scott Cooper and Smit Cynthia
Current Estimated Value
Purchase Details
Closed on
Oct 1, 2002
Sold by
Smith Scott C and Smith Cynthia G
Bought by
Smith Scott C
Purchase Details
Closed on
Sep 28, 2001
Sold by
Smith Scott C and Smith Cynthia Gillen
Bought by
Smith Scott C
Home Financials for this Owner
Home Financials are based on the most recent Mortgage that was taken out on this home.
Original Mortgage
$160,000
Outstanding Balance
$62,584
Interest Rate
6.88%
Estimated Equity
$266,387
Purchase Details
Closed on
Oct 17, 1994
Sold by
Caldwell Mark D and Caldwell Suzanne L
Bought by
Smith Scott C and Smith Cynthia Gillen
Home Financials for this Owner
Home Financials are based on the most recent Mortgage that was taken out on this home.
Original Mortgage
$152,000
Interest Rate
6.75%
Create a Home Valuation Report for This Property
The Home Valuation Report is an in-depth analysis detailing your home's value as well as a comparison with similar homes in the area
Home Values in the Area
Average Home Value in this Area
Purchase History
| Date | Buyer | Sale Price | Title Company |
|---|---|---|---|
| Smith Scott Cooper | -- | Attorney | |
| Smith Scott C | -- | -- | |
| Smith Scott C | -- | -- | |
| Smith Scott C | $160,000 | Chicago Title |
Source: Public Records
Mortgage History
| Date | Status | Borrower | Loan Amount |
|---|---|---|---|
| Open | Smith Scott C | $160,000 | |
| Closed | Smith Scott C | $152,000 |
Source: Public Records
Tax History Compared to Growth
Tax History
| Year | Tax Paid | Tax Assessment Tax Assessment Total Assessment is a certain percentage of the fair market value that is determined by local assessors to be the total taxable value of land and additions on the property. | Land | Improvement |
|---|---|---|---|---|
| 2024 | $7,597 | $90,456 | $9,340 | $81,116 |
| 2023 | $7,220 | $81,801 | $8,446 | $73,355 |
| 2022 | $7,157 | $75,415 | $7,496 | $67,919 |
| 2021 | $6,803 | $70,462 | $7,004 | $63,458 |
| 2020 | $6,549 | $66,953 | $6,655 | $60,298 |
| 2019 | $6,353 | $63,911 | $6,353 | $57,558 |
| 2018 | $5,738 | $57,475 | $7,247 | $50,228 |
| 2017 | $5,625 | $54,094 | $6,821 | $47,273 |
| 2016 | $5,564 | $50,087 | $6,316 | $43,771 |
| 2013 | -- | $51,562 | $11,483 | $40,079 |
Source: Public Records
Map
Nearby Homes
- 331 Chestnut St
- 908 Bunker St
- 601 S Jefferson St
- 155 Lee Ann Ln
- 434 Lake Ave
- 1380 Sandpiper Ln
- 415 Dean St
- 104 Stewart Ave
- 125 Forest Ave
- 330 Lake Ave
- 421 W Kimball Ave
- 9999 E Calhoun St
- 2007 Edgewood Dr
- 1288 Prairie Ridge Trail
- 3848 Riverwoods Dr
- 3902 Riverwoods Dr
- 3842 Riverwoods Dr
- 3839 Riverwoods Dr
- Townsend Plan at Clublands of Antioch - Horizon Series
- Napa Plan at Clublands of Antioch - Andare Series
- 408 Oakwood Ave
- 424 Oakwood Ave
- 429 E Kimball Ave
- 435 E Kimball Ave
- 423 E Kimball Ave
- 901 S Jefferson St
- 903 S Jefferson St
- 441 E Kimball Ave
- 829 S Jefferson St
- 820 Roosevelt Rd Unit 2
- 905 S Jefferson St
- 829 Roosevelt Rd
- 509 E Kimball Ave
- 430 Oakwood Ave
- 825 S Jefferson St
- 927 S Jefferson St
- 930 Laurel Ave
- 515 E Kimball Ave
- 811 S Jefferson St
- 431 Oakwood Ave