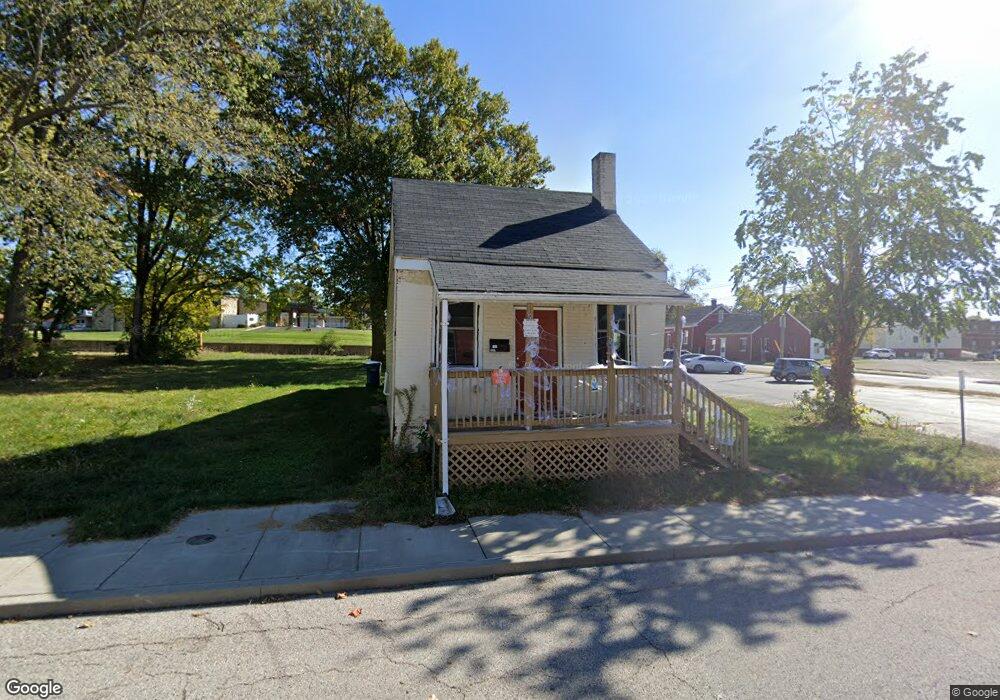
416 S 1st St Belleville, IL 62220
Estimated Value: $62,000 - $85,000
--
Bed
--
Bath
531
Sq Ft
$146/Sq Ft
Est. Value
About This Home
This home is located at 416 S 1st St, Belleville, IL 62220 and is currently estimated at $77,407, approximately $145 per square foot. 416 S 1st St is a home located in St. Clair County with nearby schools including Westhaven Elementary School, Central Jr High School, and Notre Dame Academy of Belleville.
Ownership History
Date
Name
Owned For
Owner Type
Purchase Details
Closed on
May 14, 2018
Sold by
Shelton Tcb Inc
Bought by
Shelton Kimberly
Current Estimated Value
Home Financials for this Owner
Home Financials are based on the most recent Mortgage that was taken out on this home.
Original Mortgage
$31,000
Interest Rate
4.6%
Mortgage Type
Construction
Purchase Details
Closed on
Jan 26, 2018
Sold by
Shelton Chester and Shelton Kimberly K
Bought by
Shelton Tcb Inc
Purchase Details
Closed on
Sep 23, 2013
Sold by
Santos Suzanne C
Bought by
Shelton Chet and Shelton Kim
Purchase Details
Closed on
Jun 24, 2009
Sold by
Likert Robert S
Bought by
Santos Suzanne C
Purchase Details
Closed on
Oct 9, 2007
Sold by
Green Tree Servicing Llc
Bought by
Likert Robert S
Purchase Details
Closed on
Jan 25, 2007
Sold by
Lynch Randall D
Bought by
Green Tree Servicing Llc and Conseco Finance Servicing Corp
Create a Home Valuation Report for This Property
The Home Valuation Report is an in-depth analysis detailing your home's value as well as a comparison with similar homes in the area
Home Values in the Area
Average Home Value in this Area
Purchase History
| Date | Buyer | Sale Price | Title Company |
|---|---|---|---|
| Shelton Kimberly | -- | First American Title | |
| Shelton Tcb Inc | -- | Attorney | |
| Shelton Chet | $10,000 | Town & Country Title Co | |
| Santos Suzanne C | $10,000 | Chicago Title | |
| Likert Robert S | $7,000 | Chicago Title | |
| Green Tree Servicing Llc | -- | None Available |
Source: Public Records
Mortgage History
| Date | Status | Borrower | Loan Amount |
|---|---|---|---|
| Closed | Shelton Kimberly | $31,000 |
Source: Public Records
Tax History Compared to Growth
Tax History
| Year | Tax Paid | Tax Assessment Tax Assessment Total Assessment is a certain percentage of the fair market value that is determined by local assessors to be the total taxable value of land and additions on the property. | Land | Improvement |
|---|---|---|---|---|
| 2024 | $1,973 | $22,441 | $3,757 | $18,684 |
| 2023 | $1,987 | $21,170 | $3,683 | $17,487 |
| 2022 | $1,824 | $19,059 | $3,316 | $15,743 |
| 2021 | $1,757 | $17,620 | $3,066 | $14,554 |
| 2020 | $1,708 | $16,662 | $2,899 | $13,763 |
| 2019 | $1,791 | $17,283 | $2,904 | $14,379 |
| 2018 | $1,751 | $16,909 | $2,841 | $14,068 |
| 2017 | $1,737 | $16,790 | $2,821 | $13,969 |
| 2016 | $1,715 | $16,433 | $2,761 | $13,672 |
| 2014 | $383 | $8,276 | $6,880 | $1,396 |
| 2013 | $757 | $8,394 | $6,978 | $1,416 |
Source: Public Records
Map
Nearby Homes
- 411 S 1st St
- 414 S 2nd St
- 416 S 2nd St
- 401 S Jackson St
- 300 S Jackson St
- 509 S Church St
- 222 S Jackson St
- 400 S Church St
- 508 Freeburg Ave
- 614 S Church St
- 310 S Church St
- 415 S Charles St
- 907 S Jackson St
- 928 S High St
- 204 W Main St
- 323 W Cleveland Ave
- 320 W Cleveland Ave
- 208 S Charles St
- 412 E Mckinley St
- 122 Mascoutah Ave