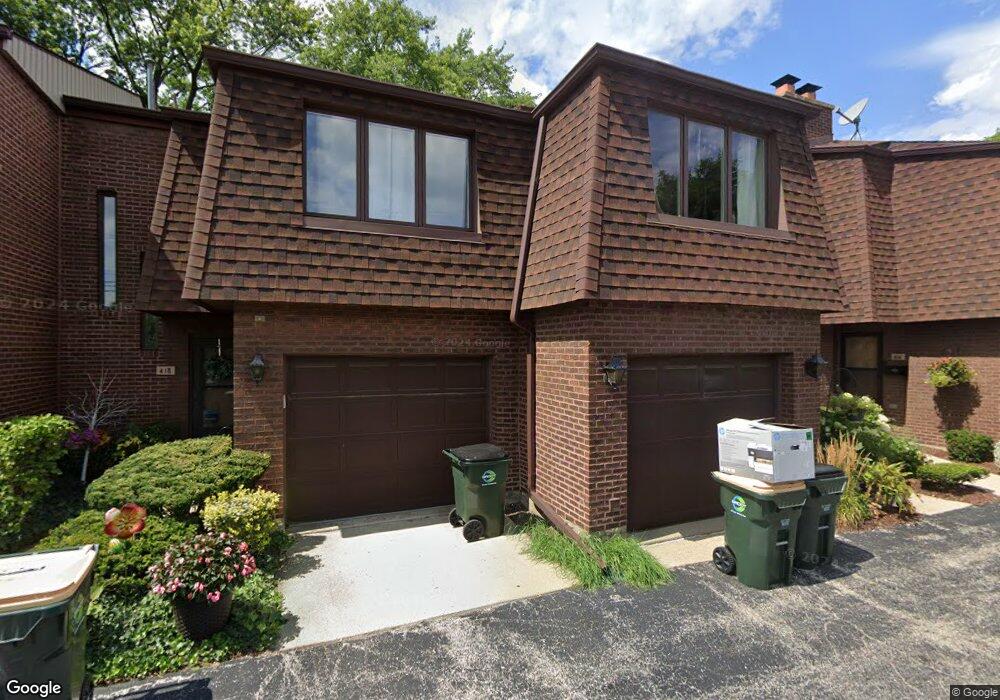
416 S Dee Rd Unit T-HS Park Ridge, IL 60068
Estimated Value: $346,000 - $360,461
2
Beds
3
Baths
1,800
Sq Ft
$197/Sq Ft
Est. Value
About This Home
This home is located at 416 S Dee Rd Unit T-HS, Park Ridge, IL 60068 and is currently estimated at $354,487, approximately $196 per square foot. 416 S Dee Rd Unit T-HS is a home located in Cook County with nearby schools including George Washington Elementary School, Lincoln Middle School, and Maine South High School.
Ownership History
Date
Name
Owned For
Owner Type
Purchase Details
Closed on
Nov 4, 2014
Sold by
Demeo Robert and Demeo Lyn
Bought by
Rasch Christopher L
Current Estimated Value
Home Financials for this Owner
Home Financials are based on the most recent Mortgage that was taken out on this home.
Original Mortgage
$240,350
Outstanding Balance
$188,232
Interest Rate
4.62%
Mortgage Type
New Conventional
Estimated Equity
$166,255
Purchase Details
Closed on
Dec 20, 2006
Sold by
Demeo Lyn and Demeo Christina
Bought by
Demeo Robert
Purchase Details
Closed on
Jun 19, 2000
Sold by
Gray Daryl Ann
Bought by
Demeo Lyn S and Demeo Christina C
Purchase Details
Closed on
Dec 11, 1996
Sold by
American National Bk & Tr Co Of Chicago
Bought by
Gray Daryl Ann
Home Financials for this Owner
Home Financials are based on the most recent Mortgage that was taken out on this home.
Original Mortgage
$90,000
Interest Rate
7.85%
Create a Home Valuation Report for This Property
The Home Valuation Report is an in-depth analysis detailing your home's value as well as a comparison with similar homes in the area
Home Values in the Area
Average Home Value in this Area
Purchase History
| Date | Buyer | Sale Price | Title Company |
|---|---|---|---|
| Rasch Christopher L | $253,000 | Fidelity | |
| Demeo Robert | -- | None Available | |
| Demeo Lyn S | $241,000 | -- | |
| Gray Daryl Ann | $205,000 | Mercury Title Company |
Source: Public Records
Mortgage History
| Date | Status | Borrower | Loan Amount |
|---|---|---|---|
| Open | Rasch Christopher L | $240,350 | |
| Previous Owner | Gray Daryl Ann | $90,000 |
Source: Public Records
Tax History Compared to Growth
Tax History
| Year | Tax Paid | Tax Assessment Tax Assessment Total Assessment is a certain percentage of the fair market value that is determined by local assessors to be the total taxable value of land and additions on the property. | Land | Improvement |
|---|---|---|---|---|
| 2024 | $5,953 | $25,251 | $2,769 | $22,482 |
| 2023 | $5,677 | $25,251 | $2,769 | $22,482 |
| 2022 | $5,677 | $25,251 | $2,769 | $22,482 |
| 2021 | $4,120 | $16,878 | $3,361 | $13,517 |
| 2020 | $4,024 | $16,878 | $3,361 | $13,517 |
| 2019 | $4,040 | $18,931 | $3,361 | $15,570 |
| 2018 | $3,689 | $16,327 | $2,966 | $13,361 |
| 2017 | $3,691 | $16,327 | $2,966 | $13,361 |
| 2016 | $3,795 | $16,327 | $2,966 | $13,361 |
| 2015 | $3,999 | $15,590 | $2,570 | $13,020 |
| 2014 | $3,937 | $15,590 | $2,570 | $13,020 |
| 2013 | $3,174 | $15,590 | $2,570 | $13,020 |
Source: Public Records
Map
Nearby Homes
- 414 S Dee Rd Unit 13
- 2300 Windsor Mall Unit 1F
- 2300 Windsor Mall Unit 2E
- 2500 Archbury Ln Unit 2D
- 2500 Windsor Mall Unit 1J
- 500 Thames Pkwy Unit 1F
- 200 Thames Pkwy Unit 1
- 60 S Dee Rd Unit G
- 20 S Dee Rd
- 516 Engel Blvd
- 44 Park Ln Unit 223
- 44 Park Ln Unit 435
- 22 Park Ln Unit 203
- 300 Boardwalk Place Unit T300
- 929 S Aldine Ave
- 600 S Greenwood Ave
- 408 N Seminary Ave
- 1301 W Touhy Ave Unit 315
- 38 E Touhy Ave
- 2166 Laura Ln
- 416 S Dee Rd Unit 12
- 420 S Dee Rd Unit 10
- 412 S Dee Rd Unit 14
- 406 S Dee Rd Unit 17
- 424 S Dee Rd Unit 8
- 410 S Dee Rd Unit 15
- 404 S Dee Rd Unit 18
- 404 S Dee Rd Unit 404
- 408 S Dee Rd Unit 16
- 428 S Dee Rd Unit 6
- 432 S Dee Rd Unit 4
- 426 S Dee Rd Unit 7
- 436 S Dee Rd Unit 2
- 436 S Dee Rd Unit 436
- 438 S Dee Rd Unit 1
- 434 S Dee Rd Unit 3
- 422 S Dee Rd Unit 9
- 418 S Dee Rd Unit 11
- 402 S Dee Rd Unit 19
- 315 S Dee Rd