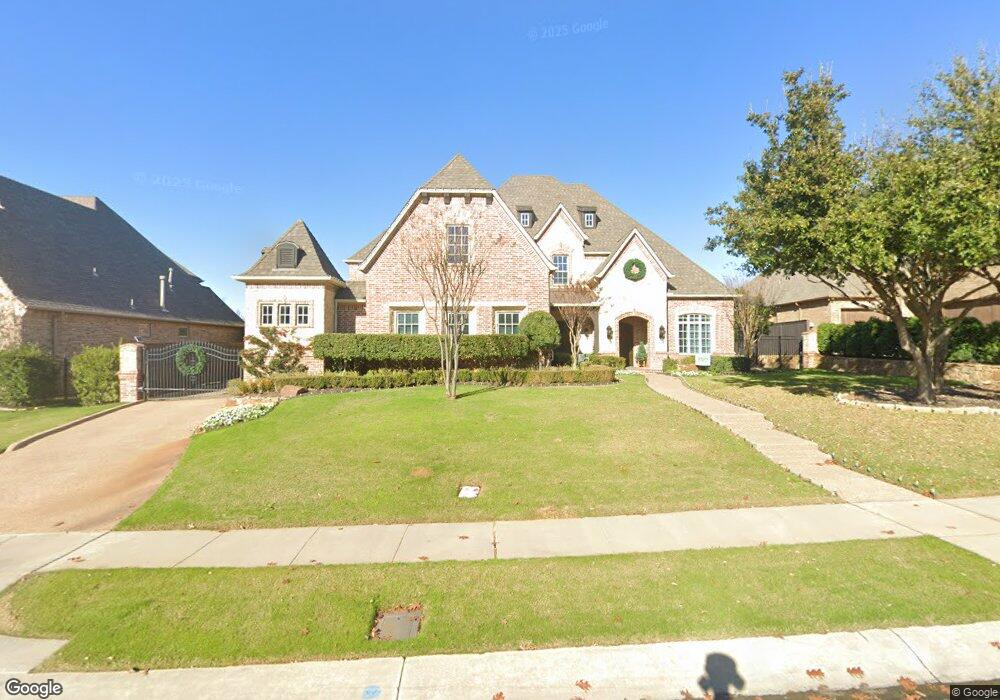
416 W Chapel Downs Dr Southlake, TX 76092
Estimated Value: $1,999,000 - $2,251,047
5
Beds
5
Baths
5,321
Sq Ft
$401/Sq Ft
Est. Value
About This Home
This home is located at 416 W Chapel Downs Dr, Southlake, TX 76092 and is currently estimated at $2,134,349, approximately $401 per square foot. 416 W Chapel Downs Dr is a home located in Tarrant County with nearby schools including Don T. Durham Intermediate School, Walnut Grove Elementary School, and Carroll Middle School.
Ownership History
Date
Name
Owned For
Owner Type
Purchase Details
Closed on
Dec 11, 2018
Sold by
Mclendon James E and Mclendon Amanda J
Bought by
Gordon Kaverock Hugh and Laverock Dana Irene
Current Estimated Value
Home Financials for this Owner
Home Financials are based on the most recent Mortgage that was taken out on this home.
Original Mortgage
$640,000
Outstanding Balance
$560,405
Interest Rate
4.5%
Mortgage Type
Purchase Money Mortgage
Estimated Equity
$1,573,944
Purchase Details
Closed on
Aug 10, 2007
Sold by
Tuscany American Homes Inc
Bought by
Mclendon James S and Mclendon Amanda J
Home Financials for this Owner
Home Financials are based on the most recent Mortgage that was taken out on this home.
Original Mortgage
$728,075
Interest Rate
6%
Mortgage Type
Purchase Money Mortgage
Purchase Details
Closed on
Jun 14, 2006
Sold by
Savannah Court Partnership
Bought by
Tuscany American Homes Inc
Home Financials for this Owner
Home Financials are based on the most recent Mortgage that was taken out on this home.
Original Mortgage
$744,000
Interest Rate
6.58%
Mortgage Type
Purchase Money Mortgage
Create a Home Valuation Report for This Property
The Home Valuation Report is an in-depth analysis detailing your home's value as well as a comparison with similar homes in the area
Home Values in the Area
Average Home Value in this Area
Purchase History
| Date | Buyer | Sale Price | Title Company |
|---|---|---|---|
| Gordon Kaverock Hugh | -- | Independence Title Co | |
| Mclendon James S | -- | None Available | |
| Tuscany American Homes Inc | -- | None Available |
Source: Public Records
Mortgage History
| Date | Status | Borrower | Loan Amount |
|---|---|---|---|
| Open | Gordon Kaverock Hugh | $640,000 | |
| Previous Owner | Mclendon James S | $728,075 | |
| Previous Owner | Tuscany American Homes Inc | $744,000 |
Source: Public Records
Tax History Compared to Growth
Tax History
| Year | Tax Paid | Tax Assessment Tax Assessment Total Assessment is a certain percentage of the fair market value that is determined by local assessors to be the total taxable value of land and additions on the property. | Land | Improvement |
|---|---|---|---|---|
| 2025 | $23,181 | $2,045,108 | $361,425 | $1,683,683 |
| 2024 | $23,181 | $2,045,108 | $361,425 | $1,683,683 |
| 2023 | $25,644 | $1,786,571 | $361,425 | $1,425,146 |
| 2022 | $27,594 | $1,550,372 | $240,950 | $1,309,422 |
| 2021 | $26,511 | $1,162,761 | $240,950 | $921,811 |
| 2020 | $26,989 | $1,174,134 | $216,855 | $957,279 |
| 2019 | $28,816 | $1,190,000 | $275,000 | $915,000 |
| 2018 | $25,308 | $1,100,000 | $200,000 | $900,000 |
| 2017 | $28,282 | $1,163,220 | $200,000 | $963,220 |
| 2016 | $25,711 | $1,170,244 | $200,000 | $970,244 |
| 2015 | $22,961 | $943,000 | $150,000 | $793,000 |
| 2014 | $22,961 | $1,018,100 | $150,000 | $868,100 |
Source: Public Records
Map
Nearby Homes
- 912 Berkshire Rd
- 1101 Linnea Ln
- 106 Ascot Dr
- 300 Shady Oaks Dr
- 903 San Saba Dr
- 711 Saratoga Dr
- 1275 Shady Oaks Dr
- 810 Brazos Dr
- 403 Presidio Ct
- 1285 Shady Oaks Dr
- 914 Turnberry Ln
- 102 Springbrook Ct
- 205 Edinburgh Ct
- 1402 Thetford Ct
- 351 S White Chapel Blvd
- 501 Fox Glen
- 806 Ridgedale Ct
- 1425 N Peytonville Ave
- 221 Pine Dr
- 305 Canyon Lake Dr
- 412 W Chapel Downs Dr
- 424 W Chapel Downs Dr
- 415 W Chapel Downs Dr
- 433 Chapel Downs Ct
- 428 W Chapel Downs Dr
- 608 Chapel Ct
- 404 W Chapel Downs Dr
- 437 Chapel Downs Ct
- 600 Chapel Ct
- 432 Chapel Downs Ct
- 400 W Chapel Downs Dr
- 441 Chapel Downs Ct
- 401 W Chapel Downs Dr
- 436 Chapel Downs Ct
- 601 Chapel Ct
- 325 W Chapel Downs Dr
- 609 Chapel Ct
- 440 Chapel Downs Ct
- 605 Chapel Ct
- 700 Truelove Trail