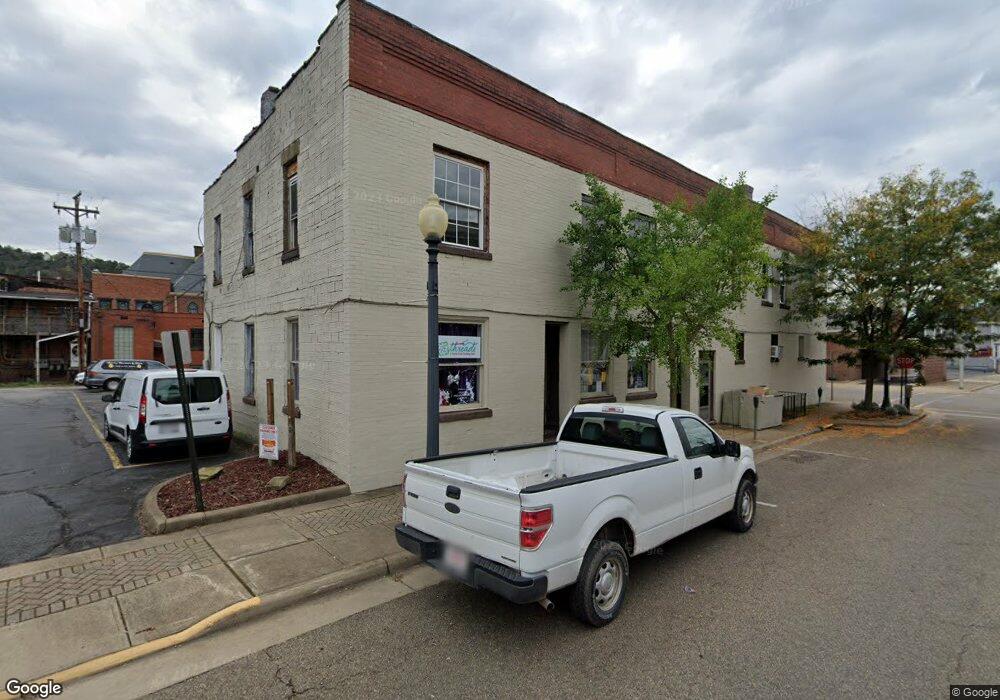
416 Walnut St Martins Ferry, OH 43935
Estimated Value: $18,528 - $122,000
5
Beds
2
Baths
2,496
Sq Ft
$28/Sq Ft
Est. Value
About This Home
This home is located at 416 Walnut St, Martins Ferry, OH 43935 and is currently estimated at $70,882, approximately $28 per square foot. 416 Walnut St is a home located in Belmont County with nearby schools including Anna Marie Ayers Elementary School, Martins Ferry Middle School, and Martins Ferry High School.
Ownership History
Date
Name
Owned For
Owner Type
Purchase Details
Closed on
Aug 26, 2015
Sold by
Coffield Tylene and Coffield Michael
Bought by
Charnock Richard Lee
Current Estimated Value
Purchase Details
Closed on
Aug 3, 2015
Sold by
Estate Of William D Behrens
Bought by
Coffield Tylene
Purchase Details
Closed on
Jun 10, 2011
Sold by
Estate Of Eileen May Behrens
Bought by
Behrens William D
Purchase Details
Closed on
Aug 22, 2003
Sold by
Behrens Eileen M
Bought by
Behrens Eileen M
Purchase Details
Closed on
Feb 10, 2003
Bought by
Greenwich Investors Xi Ll
Purchase Details
Closed on
Feb 6, 2001
Bought by
Associates Home Equity Se
Purchase Details
Closed on
Sep 12, 2000
Bought by
Associates Home Equity Se
Purchase Details
Closed on
Mar 11, 2000
Sold by
Charlton James E and Charlton Judy A
Bought by
Charlton James E and Charlton Judy A
Purchase Details
Closed on
Apr 21, 1999
Sold by
Joseph Mary Louise
Bought by
Joseph Mary Louise
Purchase Details
Closed on
Jan 1, 1986
Bought by
Nichelson James L Etal 1
Create a Home Valuation Report for This Property
The Home Valuation Report is an in-depth analysis detailing your home's value as well as a comparison with similar homes in the area
Home Values in the Area
Average Home Value in this Area
Purchase History
| Date | Buyer | Sale Price | Title Company |
|---|---|---|---|
| Charnock Richard Lee | $9,000 | Attorney | |
| Coffield Tylene | -- | Attorney | |
| Behrens William D | -- | Attorney | |
| Behrens Eileen M | $17,500 | -- | |
| Greenwich Investors Xi Ll | $4,000 | -- | |
| Associates Home Equity Se | -- | -- | |
| Associates Home Equity Se | -- | -- | |
| Charlton James E | $75,000 | -- | |
| Joseph Mary Louise | $20,000 | -- | |
| Nichelson James L Etal 1 | -- | -- |
Source: Public Records
Tax History Compared to Growth
Tax History
| Year | Tax Paid | Tax Assessment Tax Assessment Total Assessment is a certain percentage of the fair market value that is determined by local assessors to be the total taxable value of land and additions on the property. | Land | Improvement |
|---|---|---|---|---|
| 2024 | $168 | $3,960 | $2,450 | $1,510 |
| 2023 | $1,638 | $14,830 | $2,470 | $12,360 |
| 2022 | $843 | $14,829 | $2,474 | $12,355 |
| 2021 | $676 | $14,829 | $2,474 | $12,355 |
| 2020 | $634 | $12,890 | $2,150 | $10,740 |
| 2019 | $636 | $12,890 | $2,150 | $10,740 |
| 2018 | $571 | $12,890 | $2,150 | $10,740 |
| 2017 | $458 | $9,380 | $4,520 | $4,860 |
| 2016 | $463 | $9,380 | $4,520 | $4,860 |
| 2015 | $419 | $9,380 | $4,520 | $4,860 |
| 2014 | $501 | $10,590 | $4,110 | $6,480 |
| 2013 | $144 | $10,590 | $4,110 | $6,480 |
Source: Public Records
Map
Nearby Homes