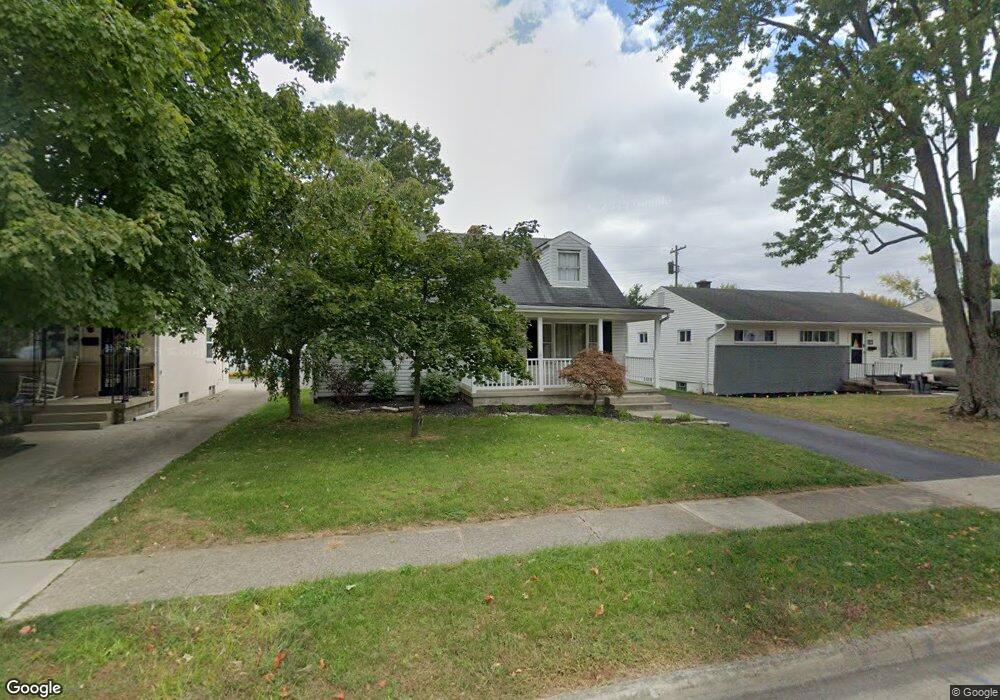
4160 Maplegrove Dr Grove City, OH 43123
Estimated Value: $242,000 - $293,000
4
Beds
2
Baths
1,308
Sq Ft
$206/Sq Ft
Est. Value
About This Home
This home is located at 4160 Maplegrove Dr, Grove City, OH 43123 and is currently estimated at $269,421, approximately $205 per square foot. 4160 Maplegrove Dr is a home located in Franklin County with nearby schools including Jc Sommer Elementary School, Park Street Intermediate School, and Jackson Middle School.
Ownership History
Date
Name
Owned For
Owner Type
Purchase Details
Closed on
Jun 22, 2020
Sold by
Killian Jeffrey A and Byrne Sherry L
Bought by
Dardinger Robert and Dardinger Dianna L
Current Estimated Value
Purchase Details
Closed on
Jan 21, 2013
Sold by
Hill Heath A
Bought by
Killian Jeffrey A and Killian Sherry L
Home Financials for this Owner
Home Financials are based on the most recent Mortgage that was taken out on this home.
Original Mortgage
$94,000
Interest Rate
4.25%
Mortgage Type
Adjustable Rate Mortgage/ARM
Purchase Details
Closed on
May 29, 2009
Sold by
Miller Rebecca A
Bought by
Hill Heath A
Home Financials for this Owner
Home Financials are based on the most recent Mortgage that was taken out on this home.
Original Mortgage
$117,826
Interest Rate
4.84%
Mortgage Type
FHA
Purchase Details
Closed on
May 21, 1991
Bought by
Miller Rebecca A
Purchase Details
Closed on
Jun 1, 1986
Create a Home Valuation Report for This Property
The Home Valuation Report is an in-depth analysis detailing your home's value as well as a comparison with similar homes in the area
Home Values in the Area
Average Home Value in this Area
Purchase History
| Date | Buyer | Sale Price | Title Company |
|---|---|---|---|
| Dardinger Robert | $82,000 | Pm Title Llc | |
| Killian Jeffrey A | $118,000 | None Available | |
| Hill Heath A | $120,000 | Talon Group | |
| Miller Rebecca A | $68,000 | -- | |
| -- | $54,000 | -- |
Source: Public Records
Mortgage History
| Date | Status | Borrower | Loan Amount |
|---|---|---|---|
| Previous Owner | Killian Jeffrey A | $94,000 | |
| Previous Owner | Hill Heath A | $117,826 |
Source: Public Records
Tax History Compared to Growth
Tax History
| Year | Tax Paid | Tax Assessment Tax Assessment Total Assessment is a certain percentage of the fair market value that is determined by local assessors to be the total taxable value of land and additions on the property. | Land | Improvement |
|---|---|---|---|---|
| 2024 | $3,357 | $72,040 | $16,700 | $55,340 |
| 2023 | $3,311 | $72,030 | $16,695 | $55,335 |
| 2022 | $2,751 | $44,000 | $7,420 | $36,580 |
| 2021 | $2,804 | $44,000 | $7,420 | $36,580 |
| 2020 | $2,796 | $44,000 | $7,420 | $36,580 |
| 2019 | $2,522 | $36,760 | $6,200 | $30,560 |
| 2018 | $2,798 | $36,760 | $6,200 | $30,560 |
| 2017 | $2,751 | $36,760 | $6,200 | $30,560 |
| 2016 | $2,996 | $40,190 | $7,180 | $33,010 |
| 2015 | $3,082 | $40,190 | $7,180 | $33,010 |
| 2014 | $2,995 | $40,190 | $7,180 | $33,010 |
| 2013 | $1,376 | $40,180 | $7,175 | $33,005 |
Source: Public Records
Map
Nearby Homes
- 2746 Queensway Dr
- 4236 Maplegrove Dr
- 4111 Ashgrove Dr
- 4277 Beechgrove Dr
- 2690 Eugene Ave
- 3910 Security Dr
- 4287 Knapp Dr
- 3084 Sawyer Dr
- 3944 Girbert St
- 4205 Patzer Ave
- 4256 Eleanor Ave
- 3687 Homecomer Dr
- 3163 Gunderman Ave
- 3815 Queen Anne Place Unit B19
- 3826 Queen Anne Place Unit B7
- 3830 Queen Anne Place Unit A9
- 3828 Queen Anne Place Unit B8
- 2403 White Rd
- 3660 Brinkman Dr
- 3933 Glenna Ave
- 4166 Maplegrove Dr
- 4152 Maplegrove Dr
- 4146 Maplegrove Dr
- 4172 Maplegrove Dr
- 4155 Joyce Rd
- 4163 Joyce Rd
- 4159 Maplegrove Dr
- 4147 Joyce Rd
- 4140 Maplegrove Dr
- 4171 Joyce Rd
- 4180 Maplegrove Dr
- 4165 Maplegrove Dr
- 4153 Maplegrove Dr
- 4139 Joyce Rd
- 4145 Maplegrove Dr
- 4173 Maplegrove Dr
- 4179 Joyce Rd
- 4186 Maplegrove Dr
- 4134 Maplegrove Dr
- 4139 Maplegrove Dr