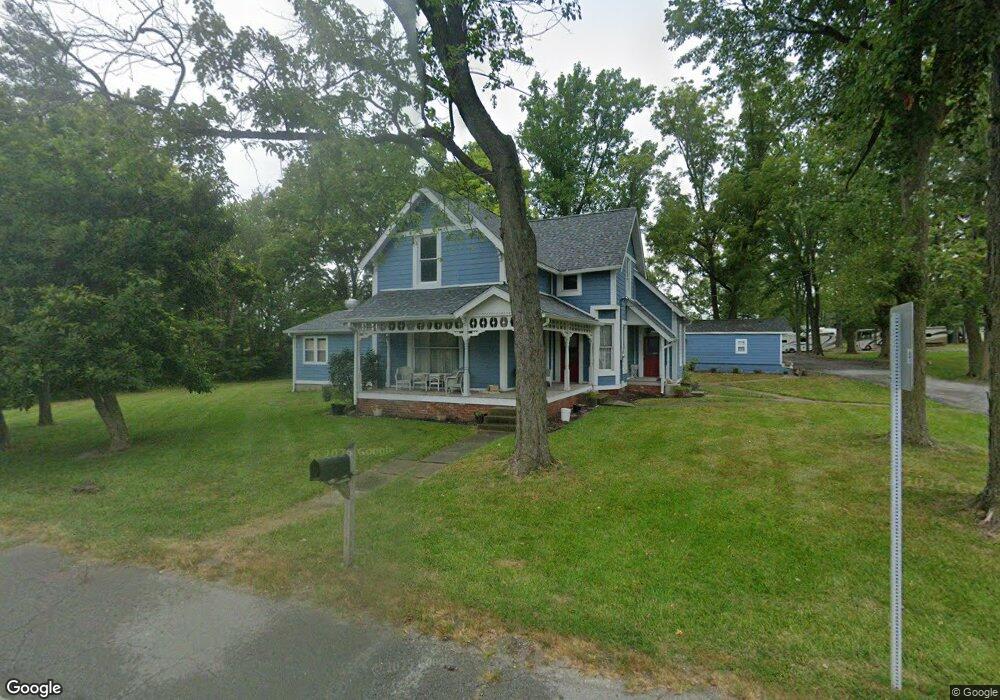
4160 W 176th St Sheridan, IN 46069
Estimated Value: $306,546 - $577,000
4
Beds
2
Baths
3,071
Sq Ft
$136/Sq Ft
Est. Value
About This Home
This home is located at 4160 W 176th St, Sheridan, IN 46069 and is currently estimated at $417,637, approximately $135 per square foot. 4160 W 176th St is a home located in Hamilton County with nearby schools including Westfield Intermediate School, Monon Trail Elementary School, and Westfield Middle School.
Ownership History
Date
Name
Owned For
Owner Type
Purchase Details
Closed on
Aug 2, 2023
Sold by
Roberts Mary Ellen
Bought by
Acm Collins Properties Llc
Current Estimated Value
Purchase Details
Closed on
May 26, 2017
Sold by
Stultz Sue A
Bought by
Roberts Mary Ellen
Purchase Details
Closed on
Feb 25, 2015
Sold by
Roberts Gregg and Roberts Mary
Bought by
Roberts Mary Ellen
Purchase Details
Closed on
Aug 27, 2007
Sold by
Us Bank Na Nd
Bought by
Roberts Gregg and Roberts Mary
Home Financials for this Owner
Home Financials are based on the most recent Mortgage that was taken out on this home.
Original Mortgage
$80,000
Interest Rate
6.38%
Mortgage Type
Purchase Money Mortgage
Purchase Details
Closed on
May 16, 2007
Sold by
Lemon Lee R and Lemon Jamie
Bought by
Us Bank Na Nd
Create a Home Valuation Report for This Property
The Home Valuation Report is an in-depth analysis detailing your home's value as well as a comparison with similar homes in the area
Home Values in the Area
Average Home Value in this Area
Purchase History
| Date | Buyer | Sale Price | Title Company |
|---|---|---|---|
| Acm Collins Properties Llc | $90,000 | None Listed On Document | |
| Roberts Mary Ellen | -- | None Available | |
| Roberts Mary Ellen | -- | None Available | |
| Roberts Gregg | -- | Fat | |
| Us Bank Na Nd | $127,415 | None Available |
Source: Public Records
Mortgage History
| Date | Status | Borrower | Loan Amount |
|---|---|---|---|
| Previous Owner | Roberts Gregg | $80,000 |
Source: Public Records
Tax History Compared to Growth
Tax History
| Year | Tax Paid | Tax Assessment Tax Assessment Total Assessment is a certain percentage of the fair market value that is determined by local assessors to be the total taxable value of land and additions on the property. | Land | Improvement |
|---|---|---|---|---|
| 2024 | $3,136 | $185,300 | $49,600 | $135,700 |
| 2023 | $3,171 | $134,700 | $27,400 | $107,300 |
| 2022 | $3,192 | $134,700 | $27,400 | $107,300 |
| 2021 | $3,192 | $126,900 | $27,400 | $99,500 |
| 2020 | $3,288 | $126,900 | $27,400 | $99,500 |
| 2019 | $3,255 | $119,400 | $27,400 | $92,000 |
| 2018 | $3,583 | $121,300 | $27,400 | $93,900 |
| 2017 | $3,383 | $120,600 | $27,400 | $93,200 |
| 2016 | $5,496 | $120,800 | $27,400 | $93,400 |
| 2014 | $3,542 | $142,900 | $27,000 | $115,900 |
| 2013 | $3,542 | $141,800 | $26,900 | $114,900 |
Source: Public Records
Map
Nearby Homes
- 4251 W 176th St
- 17815 Joliet Rd
- 17320 Joliet Rd
- 3818 W State Road 32
- 526 N 1200 E
- 17123 Little Eagle Creek Ave
- 19005 Mule Barn Rd
- 17299 Carlton Rd
- 2664 Flowing Creek Place
- 2191 Ryder Place
- 16741 Carlton Rd
- 17344 Hanningfield Way
- 2156 W 171st St
- 1181 W State Road 32
- 2062 W 171st St
- 16041 Flowing Creek Way
- 1285 S 1100 E
- 1951 Mildred Rd
- 1911 Goodwin Place
- 1981 Clement St
- 17610 Joliet Rd
- 17610 Joliet Rd
- 4181 W 176th St
- 17626 Joliet Rd
- 17624 Joliet Rd
- 4105 W State Road 32
- 4105 Indiana 32
- 4105 Indiana 32 Unit Suite A and B
- 4105 Indiana 32 Unit Suite A
- 4050 State Road 32 W
- 0 W Sr 32
- 0 W Sr 32 Unit MBR21159720
- 17627 Joliet Rd
- 4203 W 176th St
- 4205 W 176th St
- 17530 Joliet Rd
- 17828 Joliet Rd
- 4201 W 176th St
- 4080 W Jefferson St
- 17732 Joliet Rd