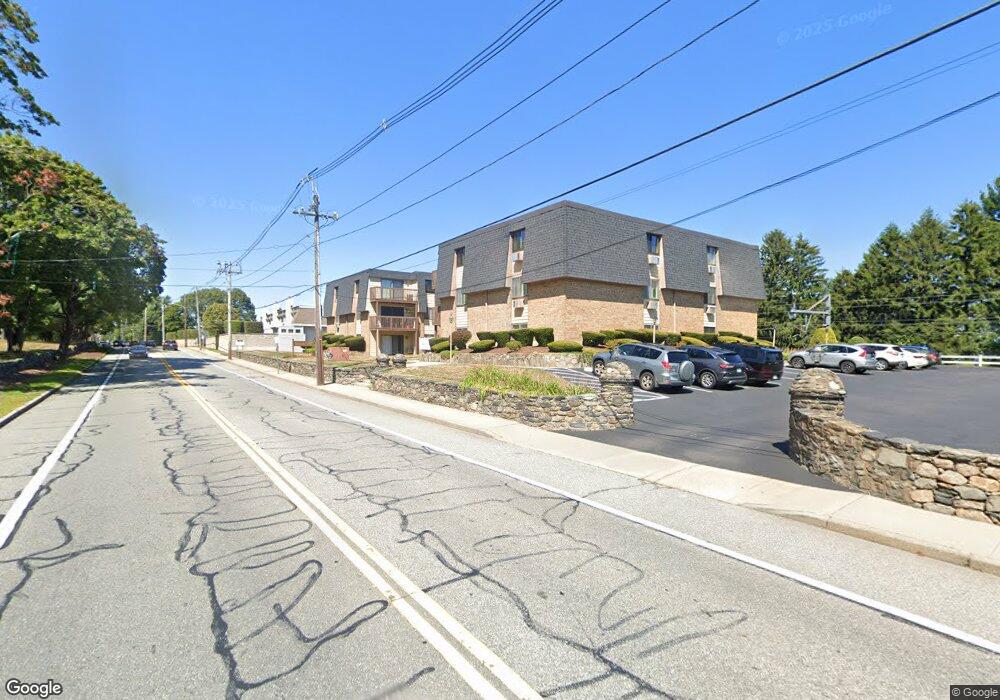
4162 Post Rd Unit 6 East Greenwich, RI 02818
Cowesett NeighborhoodEstimated Value: $296,000 - $321,000
2
Beds
2
Baths
1,105
Sq Ft
$279/Sq Ft
Est. Value
About This Home
This home is located at 4162 Post Rd Unit 6, East Greenwich, RI 02818 and is currently estimated at $308,428, approximately $279 per square foot. 4162 Post Rd Unit 6 is a home located in Kent County with nearby schools including Our Lady of Mercy School.
Ownership History
Date
Name
Owned For
Owner Type
Purchase Details
Closed on
Oct 19, 2023
Sold by
Ripa Eugene T and Ripa Helen
Bought by
Burns Roberta T
Current Estimated Value
Home Financials for this Owner
Home Financials are based on the most recent Mortgage that was taken out on this home.
Original Mortgage
$65,000
Outstanding Balance
$63,722
Interest Rate
7.12%
Mortgage Type
Purchase Money Mortgage
Estimated Equity
$244,706
Purchase Details
Closed on
Aug 26, 2021
Sold by
Costa Judy and Costa Rui
Bought by
Ripa Eugene T and Ripa Helen
Purchase Details
Closed on
May 8, 2017
Sold by
Dufault Brad A and Lima Andrea J
Bought by
Carignan Julianne
Home Financials for this Owner
Home Financials are based on the most recent Mortgage that was taken out on this home.
Original Mortgage
$144,400
Interest Rate
4.23%
Mortgage Type
New Conventional
Purchase Details
Closed on
Dec 17, 2010
Sold by
Dufault Brad A
Bought by
Dufault Brad A and Lima Andrea J
Purchase Details
Closed on
May 28, 2004
Sold by
Mcgee Kelley A
Bought by
Dufault Brad A
Home Financials for this Owner
Home Financials are based on the most recent Mortgage that was taken out on this home.
Original Mortgage
$141,200
Interest Rate
5.88%
Mortgage Type
Purchase Money Mortgage
Create a Home Valuation Report for This Property
The Home Valuation Report is an in-depth analysis detailing your home's value as well as a comparison with similar homes in the area
Home Values in the Area
Average Home Value in this Area
Purchase History
| Date | Buyer | Sale Price | Title Company |
|---|---|---|---|
| Burns Roberta T | $265,000 | None Available | |
| Ripa Eugene T | $221,000 | None Available | |
| Carignan Julianne | $152,000 | -- | |
| Dufault Brad A | -- | -- | |
| Dufault Brad A | $176,000 | -- |
Source: Public Records
Mortgage History
| Date | Status | Borrower | Loan Amount |
|---|---|---|---|
| Open | Burns Roberta T | $65,000 | |
| Previous Owner | Carignan Julianne | $144,400 | |
| Previous Owner | Dufault Brad A | $139,850 | |
| Previous Owner | Dufault Brad A | $141,200 |
Source: Public Records
Tax History Compared to Growth
Tax History
| Year | Tax Paid | Tax Assessment Tax Assessment Total Assessment is a certain percentage of the fair market value that is determined by local assessors to be the total taxable value of land and additions on the property. | Land | Improvement |
|---|---|---|---|---|
| 2024 | $2,664 | $184,100 | $0 | $184,100 |
| 2023 | $2,612 | $184,100 | $0 | $184,100 |
| 2022 | $2,680 | $143,100 | $0 | $143,100 |
| 2021 | $2,680 | $143,100 | $0 | $143,100 |
| 2020 | $2,680 | $143,100 | $0 | $143,100 |
| 2019 | $2,680 | $143,100 | $0 | $143,100 |
| 2018 | $2,001 | $96,200 | $0 | $96,200 |
| 2017 | $1,947 | $96,200 | $0 | $96,200 |
| 2016 | $1,947 | $96,200 | $0 | $96,200 |
| 2015 | $2,206 | $106,300 | $0 | $106,300 |
| 2014 | $2,132 | $106,300 | $0 | $106,300 |
| 2013 | $2,104 | $106,300 | $0 | $106,300 |
Source: Public Records
Map
Nearby Homes
- 4162 Post Rd Unit 12
- 4090 Post Rd Unit B
- 12 Manton St
- 3976 Post Rd
- 3945 Post Rd
- 199 Love Ln
- 57 Ladderlook Rd
- 0 Spencer Ave
- 97 Cowesett Rd
- 121 Hedgerow Dr
- 78 Timberline Rd
- 16 Taylor Ln
- 204 Spencer Ave
- 185 Joseph Ct
- 99 Shenandoah Rd
- 15 Anthony St
- 430 Brookline Dr
- 345 Nausauket Rd
- 25 Water St Unit 101
- 7 Cosett Rd
- 4162 Post Rd Unit 10
- 4162 Post Rd Unit 15
- 4162 Post Rd Unit 11
- 4162 Post Rd Unit 1
- 4162 Post Rd Unit 16
- 4162 Post Rd Unit 8
- 4162 Post Rd Unit 3
- 4162 Post Rd Unit 14
- 4162 Post Rd Unit 4
- 4162 Post Rd Unit 7
- 4162 Post Rd Unit 2
- 4162 Post Rd Unit 5
- 4162 Post Rd Unit 13
- 4162 Post Rd
- 4162 Post Rd Unit 2
- 4162 Post Rd Unit 15
- 4162 Post Rd Unit 4
- 4162 Post Rd Unit 1
- 4162 Post Rd Unit 14
- 4162 Post Rd Unit 6