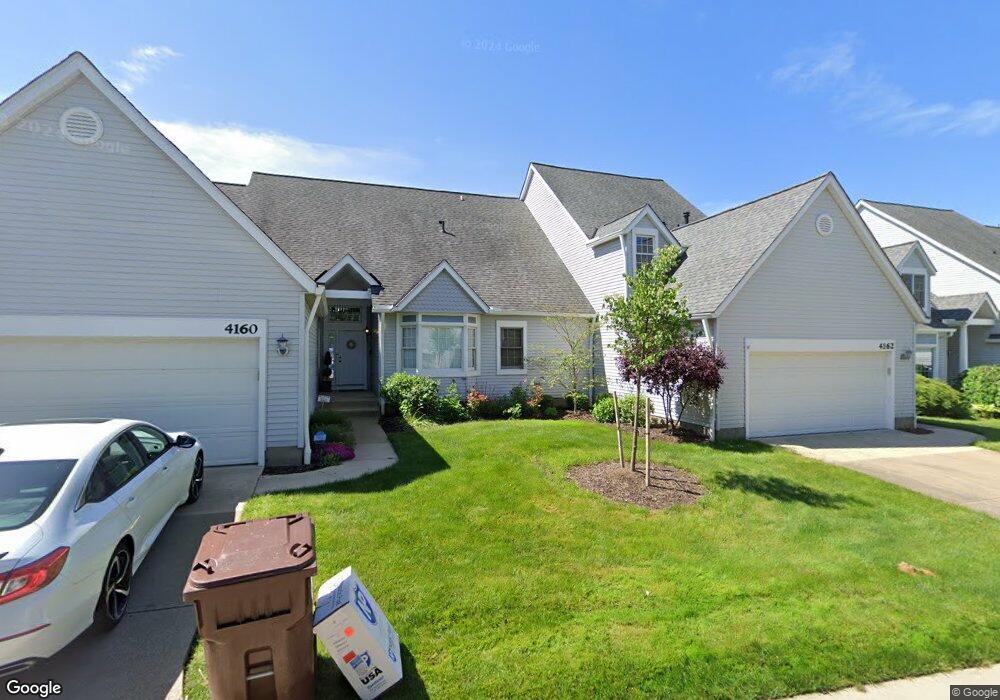
4162 Tomahawk Trace Unit K45F5 Copley, OH 44321
Estimated Value: $331,000 - $573,000
3
Beds
4
Baths
2,618
Sq Ft
$156/Sq Ft
Est. Value
About This Home
This home is located at 4162 Tomahawk Trace Unit K45F5, Copley, OH 44321 and is currently estimated at $407,591, approximately $155 per square foot. 4162 Tomahawk Trace Unit K45F5 is a home located in Summit County with nearby schools including Richfield Elementary School, Bath Elementary School, and Revere Middle School.
Ownership History
Date
Name
Owned For
Owner Type
Purchase Details
Closed on
Aug 5, 2008
Sold by
Johnson Mildred S K
Bought by
Williams Constance
Current Estimated Value
Home Financials for this Owner
Home Financials are based on the most recent Mortgage that was taken out on this home.
Original Mortgage
$180,000
Outstanding Balance
$118,660
Interest Rate
6.42%
Mortgage Type
Purchase Money Mortgage
Estimated Equity
$288,931
Purchase Details
Closed on
Feb 26, 2001
Sold by
Kratz Johnson Mildred S
Bought by
Johnson Mildred K and The Mildred S K Johnson Trust
Purchase Details
Closed on
Aug 7, 1998
Sold by
Lewis Danny R
Bought by
Johnson Mildred S Kratz
Purchase Details
Closed on
Aug 8, 1994
Sold by
Stile Louis
Bought by
Lewis Danny R
Home Financials for this Owner
Home Financials are based on the most recent Mortgage that was taken out on this home.
Original Mortgage
$163,100
Interest Rate
7.5%
Mortgage Type
New Conventional
Create a Home Valuation Report for This Property
The Home Valuation Report is an in-depth analysis detailing your home's value as well as a comparison with similar homes in the area
Home Values in the Area
Average Home Value in this Area
Purchase History
| Date | Buyer | Sale Price | Title Company |
|---|---|---|---|
| Williams Constance | $250,000 | Attorney | |
| Johnson Mildred K | -- | -- | |
| Johnson Mildred S Kratz | $225,000 | -- | |
| Lewis Danny R | $217,522 | -- |
Source: Public Records
Mortgage History
| Date | Status | Borrower | Loan Amount |
|---|---|---|---|
| Open | Williams Constance | $180,000 | |
| Previous Owner | Lewis Danny R | $163,100 |
Source: Public Records
Tax History
| Year | Tax Paid | Tax Assessment Tax Assessment Total Assessment is a certain percentage of the fair market value that is determined by local assessors to be the total taxable value of land and additions on the property. | Land | Improvement |
|---|---|---|---|---|
| 2024 | $6,032 | $106,597 | $11,435 | $95,162 |
| 2023 | $6,032 | $106,597 | $11,435 | $95,162 |
| 2022 | $5,499 | $83,364 | $8,936 | $74,428 |
| 2021 | $5,323 | $83,364 | $8,936 | $74,428 |
| 2020 | $5,192 | $83,370 | $8,940 | $74,430 |
| 2019 | $5,245 | $78,710 | $8,850 | $69,860 |
| 2018 | $5,017 | $78,710 | $8,850 | $69,860 |
| 2017 | $4,634 | $78,710 | $8,850 | $69,860 |
| 2016 | $4,803 | $72,540 | $8,850 | $63,690 |
| 2015 | $4,634 | $72,540 | $8,850 | $63,690 |
| 2014 | $4,590 | $72,540 | $8,850 | $63,690 |
| 2013 | $5,271 | $85,350 | $12,900 | $72,450 |
Source: Public Records
Map
Nearby Homes
- 522 Robinwood Ln Unit I
- 386 Caleb Dr
- 3998 Gardiner Run
- 4201 Meadowcreek Ln
- 3855 Overlook Ct
- 4204 Castle Ridge
- 3852 Overlook Ct
- 3831 Overlook Ct
- 3807 Overlook Ct
- 3800 Rosemont Blvd Unit 111B
- 3800 Rosemont Blvd Unit 113D
- 3800 Rosemont Blvd Unit 116 D
- 3800 Rosemont Blvd Unit 116C
- 3800 Rosemont Blvd Unit 101G
- 3800 Rosemont Blvd Unit 103E
- 3800 Rosemont Blvd Unit 105D
- 330 Kame Ct
- 4200 Kingsbury Blvd
- 3735 Overlook Ct
- 3791 Overlook Ct
- 4160 Tomahawk Trace
- 4164 Tomahawk Trace
- 4165 Tomahawk Trace Unit E38H2
- 4167 Tomahawk Trace
- 4168 Tomahawk Trace
- 4169 Tomahawk Trace Unit 36G/3
- 154 Tecumseh Ln
- 4163 Tomahawk Trace Unit E39F
- 155 Tecumseh Ln
- 153 Tecumseh Ln Unit C28D
- 153 Tecumseh Ln Unit 28D
- 158 Tecumseh Ln
- 4177 Apache Place
- 4173 Apache Place
- 4179 Apache Place
- 4171 Apache Place
- 160 Tecumseh Ln
- 205 Brookrun Dr
- 215 Brookrun Dr
- 156 Tecumseh Ln
Your Personal Tour Guide
Ask me questions while you tour the home.