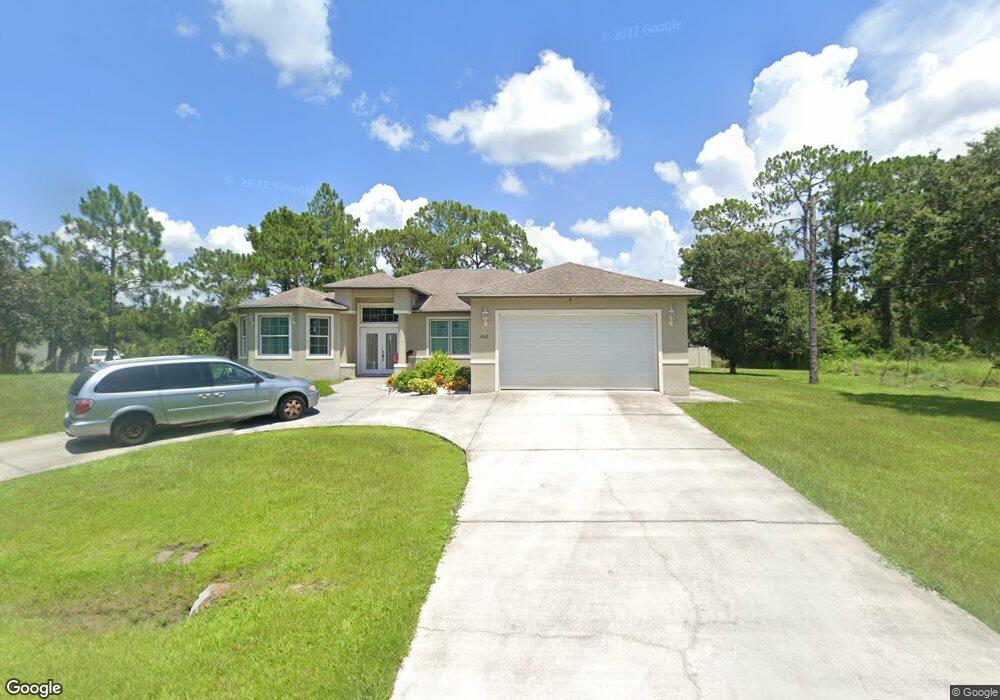
4163 Geoffrey St North Port, FL 34291
Estimated Value: $376,424 - $510,000
4
Beds
3
Baths
2,366
Sq Ft
$184/Sq Ft
Est. Value
About This Home
This home is located at 4163 Geoffrey St, North Port, FL 34291 and is currently estimated at $435,106, approximately $183 per square foot. 4163 Geoffrey St is a home with nearby schools including North Port High School, Lamarque Elementary School, and Heron Creek Middle School.
Ownership History
Date
Name
Owned For
Owner Type
Purchase Details
Closed on
May 15, 2019
Sold by
Vasigh Mohammad
Bought by
First Choice Home Builders Llc
Current Estimated Value
Purchase Details
Closed on
Jan 16, 2015
Sold by
Devin Homes Inc
Bought by
Thermidor Frantz and Thermidor Tamar
Purchase Details
Closed on
Oct 1, 2005
Sold by
Laguerre Sheila
Bought by
Devin Homes Inc
Purchase Details
Closed on
May 5, 2005
Sold by
Flebert Enel
Bought by
Laguerre Sheilla
Purchase Details
Closed on
Feb 10, 2004
Sold by
Arrow Plus Inc
Bought by
Great Sw Dev Co
Purchase Details
Closed on
Sep 18, 2003
Sold by
Brown Mary Jane
Bought by
Flebert Enel and Laguerra Sheilla
Purchase Details
Closed on
Sep 17, 2003
Sold by
Lang Hollan M
Bought by
Brown Mary Jane
Purchase Details
Closed on
Oct 16, 2000
Sold by
Source Arrow Inc
Bought by
Great Sw Dev Co
Purchase Details
Closed on
Jul 17, 2000
Sold by
Clerk Circuit Court
Bought by
Source Arrow Inc
Create a Home Valuation Report for This Property
The Home Valuation Report is an in-depth analysis detailing your home's value as well as a comparison with similar homes in the area
Home Values in the Area
Average Home Value in this Area
Purchase History
| Date | Buyer | Sale Price | Title Company |
|---|---|---|---|
| First Choice Home Builders Llc | $25,000 | Attorney | |
| Thermidor Frantz | $15,000 | None Available | |
| Devin Homes Inc | $20,000 | -- | |
| Laguerre Sheilla | -- | -- | |
| Great Sw Dev Co | $3,000 | -- | |
| Flebert Enel | $10,900 | -- | |
| Brown Mary Jane | -- | -- | |
| Great Sw Dev Co | $1,500 | -- | |
| Source Arrow Inc | $1,200 | -- |
Source: Public Records
Tax History Compared to Growth
Tax History
| Year | Tax Paid | Tax Assessment Tax Assessment Total Assessment is a certain percentage of the fair market value that is determined by local assessors to be the total taxable value of land and additions on the property. | Land | Improvement |
|---|---|---|---|---|
| 2024 | $5,793 | $330,859 | -- | -- |
| 2023 | $5,793 | $382,300 | $22,400 | $359,900 |
| 2022 | $5,997 | $395,900 | $19,700 | $376,200 |
| 2021 | $5,108 | $280,200 | $10,700 | $269,500 |
| 2020 | $4,713 | $249,700 | $8,600 | $241,100 |
| 2019 | $4,931 | $264,200 | $8,700 | $255,500 |
| 2018 | $4,428 | $247,100 | $10,500 | $236,600 |
| 2017 | $386 | $4,792 | $0 | $0 |
| 2016 | $362 | $5,100 | $5,100 | $0 |
| 2015 | $360 | $4,300 | $4,300 | $0 |
| 2014 | $343 | $3,300 | $0 | $0 |
Source: Public Records
Map
Nearby Homes
- LOT 24 Crammer Ave
- 4135 Geoffrey St
- 0 Altemus St Unit MFRC7506107
- 4270 Ascot Dr
- 4115 Geoffrey St
- 0 Amari Rd Unit MFRA4664800
- 6782 Paigo Ln
- 0 Starfish Ave Unit MFRO6230816
- 0 College Terrace Unit MFRC7513871
- 6435 College Terrace
- 4495 Amari Rd
- 4447 Heyward St
- 6909 Helliwell St
- 0 Kayak Rd Unit 225046840
- 0 Loffreda Ave Unit MFRA4610916
- 7020 Sena Rd
- 3699 Ent Terrace
- Lot 19 Bathfeld Rd
- 6794 Loffreda Ave
- 0 Hero Ave Unit MFRC7515359
- 4151 Altemus St
- 4180 Geoffrey St
- 4181 Geoffrey St
- 4148 Geoffrey St
- 4152 Altemus
- Lot 25 Altemus
- Lot 24 Altemus
- 0952124602 Altemus
- 4166 Altemus St
- 0 Cammer Ave Unit A4406049
- 0 Cammer Ave Unit A4139920
- 0 Cammer Ave Unit D5908726
- 0 Cammer Ave Unit N5772339
- 6570 Crammer Ave
- 0 Altemus St Unit D5923197
- 0 Altemus St Unit MFRC7484622
- 0 Altemus St Unit MFRC7476170
- 0 Altemus St Unit A4500089
- 0 Altemus St Unit D6116884
- 0 Geoffrey St Unit D6101820