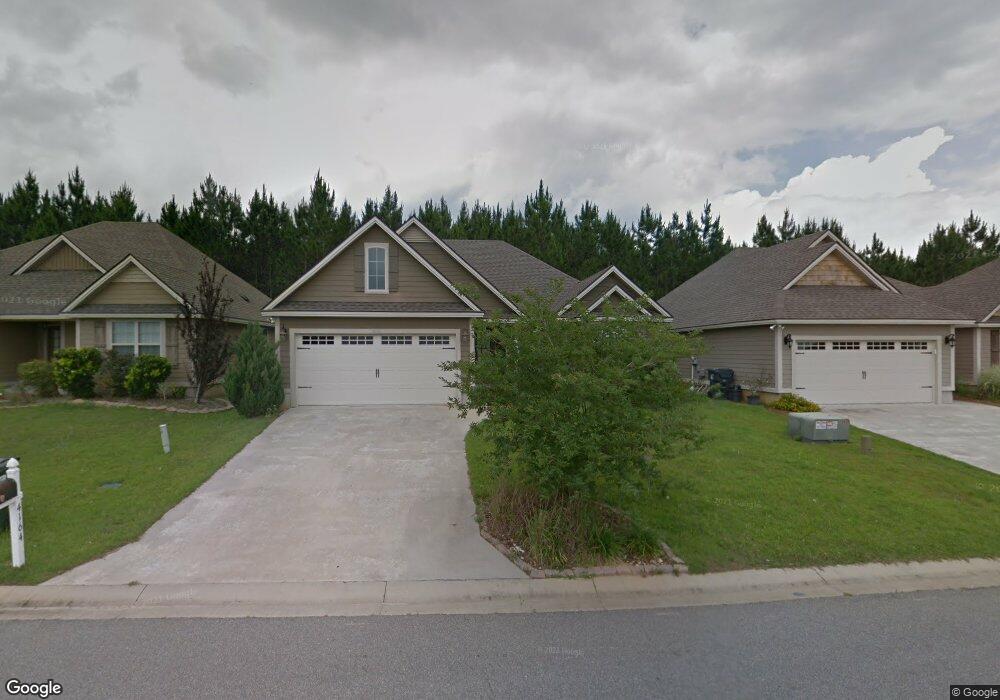
4164 Cider Trail Hahira, GA 31632
Estimated Value: $236,000 - $259,000
3
Beds
2
Baths
1,470
Sq Ft
$167/Sq Ft
Est. Value
About This Home
This home is located at 4164 Cider Trail, Hahira, GA 31632 and is currently estimated at $245,392, approximately $166 per square foot. 4164 Cider Trail is a home located in Lowndes County with nearby schools including Dewar Elementary School, Hahira Middle School, and Lowndes High School.
Ownership History
Date
Name
Owned For
Owner Type
Purchase Details
Closed on
Jul 1, 2021
Sold by
Griffin Shakeria K
Bought by
Williams Brianna Ash Lee
Current Estimated Value
Home Financials for this Owner
Home Financials are based on the most recent Mortgage that was taken out on this home.
Original Mortgage
$179,489
Outstanding Balance
$162,858
Interest Rate
2.9%
Mortgage Type
FHA
Estimated Equity
$82,534
Purchase Details
Closed on
Jun 12, 2013
Sold by
Flemacley Llc
Bought by
Griffin Shakeria K
Home Financials for this Owner
Home Financials are based on the most recent Mortgage that was taken out on this home.
Original Mortgage
$139,693
Interest Rate
3.53%
Mortgage Type
New Conventional
Purchase Details
Closed on
Sep 26, 2012
Sold by
Ameris Bank
Bought by
Flemacley Llc
Purchase Details
Closed on
Sep 9, 2011
Sold by
Nelco Inc
Bought by
Ameris Bank
Purchase Details
Closed on
Apr 22, 2008
Bought by
Nelco Inc
Create a Home Valuation Report for This Property
The Home Valuation Report is an in-depth analysis detailing your home's value as well as a comparison with similar homes in the area
Home Values in the Area
Average Home Value in this Area
Purchase History
| Date | Buyer | Sale Price | Title Company |
|---|---|---|---|
| Williams Brianna Ash Lee | $182,800 | -- | |
| Griffin Shakeria K | $136,900 | -- | |
| Flemacley Llc | $543,250 | -- | |
| Ameris Bank | -- | -- | |
| Nelco Inc | -- | -- |
Source: Public Records
Mortgage History
| Date | Status | Borrower | Loan Amount |
|---|---|---|---|
| Open | Williams Brianna Ash Lee | $179,489 | |
| Previous Owner | Griffin Shakeria K | $139,693 |
Source: Public Records
Tax History Compared to Growth
Tax History
| Year | Tax Paid | Tax Assessment Tax Assessment Total Assessment is a certain percentage of the fair market value that is determined by local assessors to be the total taxable value of land and additions on the property. | Land | Improvement |
|---|---|---|---|---|
| 2024 | $2,050 | $83,362 | $14,000 | $69,362 |
| 2023 | $2,050 | $83,362 | $14,000 | $69,362 |
| 2022 | $2,114 | $73,622 | $14,000 | $59,622 |
| 2021 | $1,734 | $57,443 | $9,000 | $48,443 |
| 2020 | $1,615 | $57,443 | $9,000 | $48,443 |
| 2019 | $1,529 | $53,716 | $9,000 | $44,716 |
| 2018 | $1,544 | $53,716 | $9,000 | $44,716 |
| 2017 | $1,561 | $53,716 | $9,000 | $44,716 |
| 2016 | $1,511 | $53,716 | $9,000 | $44,716 |
| 2015 | $1,448 | $53,716 | $9,000 | $44,716 |
| 2014 | $1,478 | $4,500 | $4,500 | $0 |
Source: Public Records
Map
Nearby Homes
- 4268 Nelson Hill Place
- 4190 Parker Trail
- 3830 Landings Cir
- 4529 Samuel Way
- 4525 Samuel Way
- 4510 Samuel Way
- 4970 Hatfield Cir
- 4860 Brown Cat Cir
- 4868 Brown Cat Cir
- 3061 Houser Way
- 5051 Hatfield Cir
- 5055 Hatfield Cir
- 3041 Houser Way
- 5039 Hatfield Cir
- 5020 Hatfield Cir
- 2048 Tottenham Dr
- 4809 Brown Cat Cir
- 4005 Ashbourne Dr
- 3883 Lu Ln
- 3871 Lu Ln
- 4160 Cider Trail
- 4168 Cider Trail
- 4156 Cider Trail
- 4172 Cider Trail
- 4159 Cider Trail
- 4189 Willow Round Rd
- 4176 Cider Trail
- 4155 Cider Trail
- 0 Cider Trail
- 4185 Willow Round Rd
- 4151 Cider Trail
- 4180 Cider Trail
- 4148 Cider Trail
- 4198 Silver Glen
- 4130 Cottage Heights Rd
- 4147 Cider Trail
- 4181 Willow Round Rd
- 4126 Cottage Heights Rd
- 4194 Silver Glen
- 4184 Cider Trail