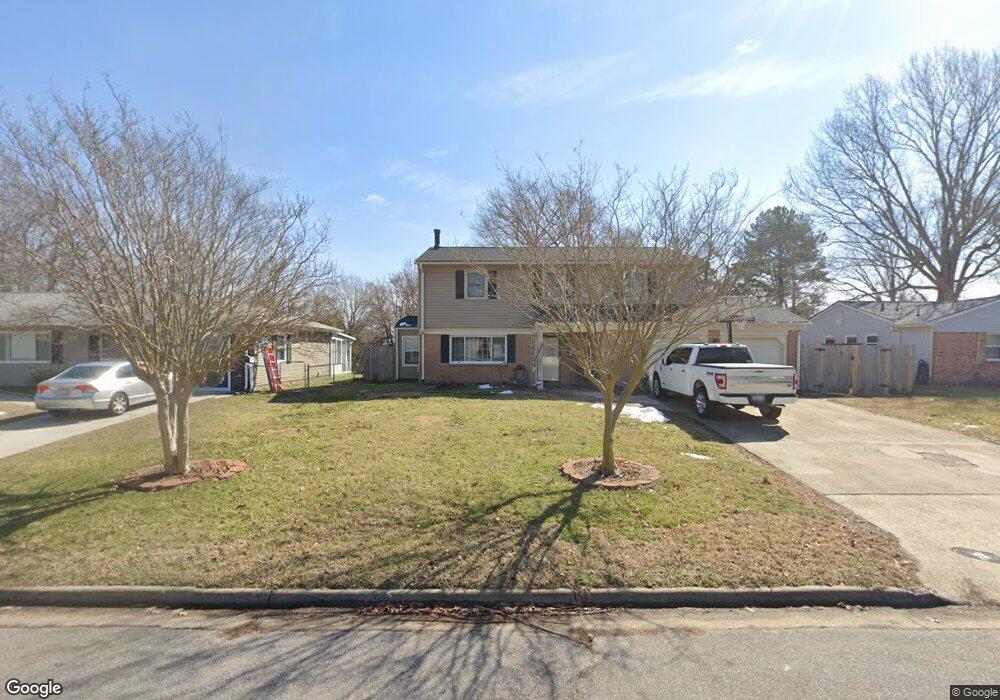
4164 Mill Stream Rd Virginia Beach, VA 23452
Larkspur NeighborhoodEstimated Value: $421,000 - $465,016
4
Beds
3
Baths
2,400
Sq Ft
$188/Sq Ft
Est. Value
About This Home
This home is located at 4164 Mill Stream Rd, Virginia Beach, VA 23452 and is currently estimated at $450,504, approximately $187 per square foot. 4164 Mill Stream Rd is a home located in Virginia Beach City with nearby schools including Windsor Oaks Elementary School, Independence Middle School, and Princess Anne High School.
Ownership History
Date
Name
Owned For
Owner Type
Purchase Details
Closed on
Mar 5, 2020
Sold by
Mcclellan Ross L and Mcclellan Carrie L
Bought by
Caravantes Darwin C Flores and Flores Hilda S
Current Estimated Value
Home Financials for this Owner
Home Financials are based on the most recent Mortgage that was taken out on this home.
Original Mortgage
$317,130
Outstanding Balance
$281,394
Interest Rate
3.6%
Mortgage Type
VA
Estimated Equity
$169,110
Purchase Details
Closed on
Apr 19, 2004
Sold by
Reed Jonathan
Bought by
Mcclellan Ross
Home Financials for this Owner
Home Financials are based on the most recent Mortgage that was taken out on this home.
Original Mortgage
$188,282
Interest Rate
5.58%
Mortgage Type
New Conventional
Purchase Details
Closed on
Nov 13, 2000
Sold by
Vacca Melinda S
Bought by
Reed Jonathan
Home Financials for this Owner
Home Financials are based on the most recent Mortgage that was taken out on this home.
Original Mortgage
$137,150
Interest Rate
7.78%
Create a Home Valuation Report for This Property
The Home Valuation Report is an in-depth analysis detailing your home's value as well as a comparison with similar homes in the area
Home Values in the Area
Average Home Value in this Area
Purchase History
| Date | Buyer | Sale Price | Title Company |
|---|---|---|---|
| Caravantes Darwin C Flores | $310,000 | Fidelity National Ttl Ins Co | |
| Mcclellan Ross | $185,500 | -- | |
| Reed Jonathan | $134,500 | -- |
Source: Public Records
Mortgage History
| Date | Status | Borrower | Loan Amount |
|---|---|---|---|
| Open | Caravantes Darwin C Flores | $317,130 | |
| Previous Owner | Mcclellan Ross | $188,282 | |
| Previous Owner | Reed Jonathan | $137,150 |
Source: Public Records
Tax History
| Year | Tax Paid | Tax Assessment Tax Assessment Total Assessment is a certain percentage of the fair market value that is determined by local assessors to be the total taxable value of land and additions on the property. | Land | Improvement |
|---|---|---|---|---|
| 2025 | $3,868 | $405,500 | $138,000 | $267,500 |
| 2024 | $3,868 | $398,800 | $138,000 | $260,800 |
Source: Public Records
Map
Nearby Homes
- 517 Windsor Gate Cir
- 3857 Old Colony Cir
- 3905 W Colonial Pkwy
- 3836 Old Forge Rd
- 3841 Colonial Pkwy
- 4072 Thomas Jefferson Dr
- 3832 Chancery Ln
- 3800 Turtle Cove Ct
- 3805 S Plaza Trail
- 3812 William Penn Blvd
- 3768 Governors Way
- 3769 Governors Way
- 3909 Inverness Rd
- 720 Linden Ct
- 228 Palace Green Blvd
- 3753 Old Forge Rd
- 640 Governors Way
- 3913 Thalia Trace Ct
- 4444 Leatherwood Dr
- 4237 Minnard Ct
- 4160 Mill Stream Rd
- 4160 Mill Stream Rd Unit Rd
- 4168 Mill Stream Rd
- 4072 Windsor Gate Place
- 4172 Mill Stream Rd
- 4156 Mill Stream Rd
- 4141 Mill Stream Rd
- 4137 Mill Stream Rd
- 4068 Windsor Gate Place
- 4145 Mill Stream Rd
- 4076 Windsor Gate Place
- 4133 Mill Stream Rd
- 4176 Mill Stream Rd
- 4152 Mill Stream Rd
- 556 Water Oak Rd
- 552 Water Oak Rd
- 4064 Windsor Gate Place
- 408 Woodlake Rd
- 412 Woodlake Rd
- 4080 Windsor Gate Place
Your Personal Tour Guide
Ask me questions while you tour the home.