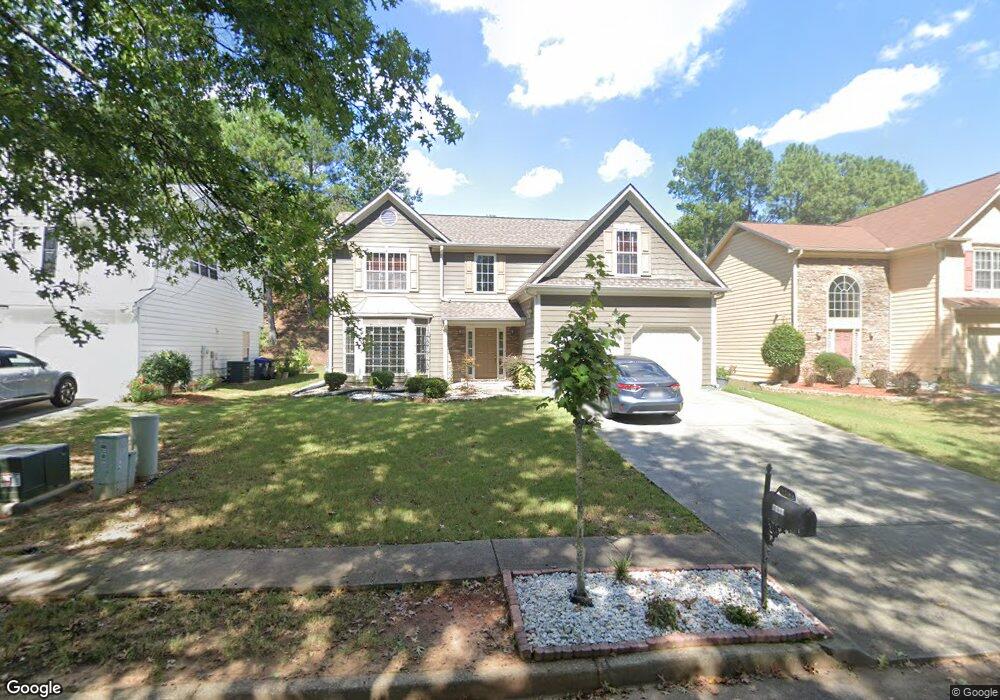
4165 Bradstone Trace NW Unit 1 Lilburn, GA 30047
Estimated Value: $397,000 - $440,000
4
Beds
3
Baths
2,483
Sq Ft
$168/Sq Ft
Est. Value
About This Home
This home is located at 4165 Bradstone Trace NW Unit 1, Lilburn, GA 30047 and is currently estimated at $418,110, approximately $168 per square foot. 4165 Bradstone Trace NW Unit 1 is a home located in Gwinnett County with nearby schools including Minor Elementary School, Berkmar Middle School, and Berkmar High School.
Ownership History
Date
Name
Owned For
Owner Type
Purchase Details
Closed on
Sep 9, 2024
Sold by
Shah Gopalchandra
Bought by
Shah Shilaben and Shah Gopalchandra
Current Estimated Value
Purchase Details
Closed on
Sep 16, 2019
Sold by
Shah Pankit
Bought by
Shah Gopalchandra
Purchase Details
Closed on
Mar 24, 2006
Sold by
Humareda Ricardo
Bought by
Shah Pankit and Shah Gopal
Home Financials for this Owner
Home Financials are based on the most recent Mortgage that was taken out on this home.
Original Mortgage
$19,500
Interest Rate
5.8%
Mortgage Type
Unknown
Purchase Details
Closed on
Sep 25, 2000
Sold by
Richport Prop Inc
Bought by
Humareda Ricardo
Home Financials for this Owner
Home Financials are based on the most recent Mortgage that was taken out on this home.
Original Mortgage
$163,500
Interest Rate
7.92%
Mortgage Type
New Conventional
Create a Home Valuation Report for This Property
The Home Valuation Report is an in-depth analysis detailing your home's value as well as a comparison with similar homes in the area
Home Values in the Area
Average Home Value in this Area
Purchase History
| Date | Buyer | Sale Price | Title Company |
|---|---|---|---|
| Shah Shilaben | -- | -- | |
| Shah Gopalchandra | -- | -- | |
| Shah Pankit | $195,000 | -- | |
| Humareda Ricardo | $168,600 | -- |
Source: Public Records
Mortgage History
| Date | Status | Borrower | Loan Amount |
|---|---|---|---|
| Previous Owner | Shah Pankit | $19,500 | |
| Previous Owner | Shah Pankit | $156,000 | |
| Previous Owner | Humareda Ricardo | $163,500 |
Source: Public Records
Tax History Compared to Growth
Tax History
| Year | Tax Paid | Tax Assessment Tax Assessment Total Assessment is a certain percentage of the fair market value that is determined by local assessors to be the total taxable value of land and additions on the property. | Land | Improvement |
|---|---|---|---|---|
| 2024 | -- | $152,200 | $24,000 | $128,200 |
| 2023 | $1,079 | $154,400 | $30,000 | $124,400 |
| 2022 | $0 | $140,520 | $24,000 | $116,520 |
| 2021 | $3,304 | $103,920 | $18,000 | $85,920 |
| 2020 | $3,304 | $99,720 | $18,000 | $81,720 |
| 2019 | $3,213 | $99,720 | $18,000 | $81,720 |
| 2018 | $3,022 | $90,760 | $18,000 | $72,760 |
| 2016 | $2,699 | $74,920 | $13,600 | $61,320 |
| 2015 | $2,670 | $72,400 | $13,600 | $58,800 |
| 2014 | $1,880 | $49,400 | $11,600 | $37,800 |
Source: Public Records
Map
Nearby Homes
- 3975 Bradstone Trace NW
- 4100 Bradstone Trace NW Unit 1
- 566 Jody Place
- 642 Huntington Way NW
- 4450 Bradstone Trace NW Unit 2
- 4082 Johns St NW
- 3951 Millwood Ln NW
- 3911 Millwood Ln NW
- 881 Huntington Way NW
- 918 Hampton Trail NW
- 0 Lawrenceville Hwy NW Unit 7662367
- 0 Lawrenceville Hwy NW Unit 10618125
- 1118 Saybrook Cir NW
- 4452 Burns Rd NW
- 1052 Rabun Dr NW Unit 2
- 4474 Casco Ln NW
- 805 Pleasant Hill Rd NW Unit 212
- 805 Pleasant Hill Rd NW Unit 703
- 805 Pleasant Hill Rd NW Unit 13-2
- 4155 Bradstone Trace NW
- 4175 Bradstone Trace NW
- 3955 Bradstone Trace NW Unit 1
- 4145 Bradstone Trace NW
- 3965 Bradstone Trace NW Unit 3965
- 3965 Bradstone Trace NW
- 4160 Bradstone Trace NW
- 4170 Bradstone Trace NW Unit 1
- 3945 Bradstone Trace NW
- 4150 Bradstone Trace NW
- 4135 Bradstone Trace NW Unit 1
- 4180 Bradstone Trace NW
- 4140 Bradstone Trace NW
- 4195 Bradstone Trace NW
- 3935 Bradstone Trace NW Unit 1
- 4045 Bradstone Trace NW
- 4055 Bradstone Trace NW Unit 1
- 4130 Bradstone Trace NW Unit 1
- 3960 Bradstone Trace NW Unit 1
- 4075 Bradstone Trace NW Unit 1