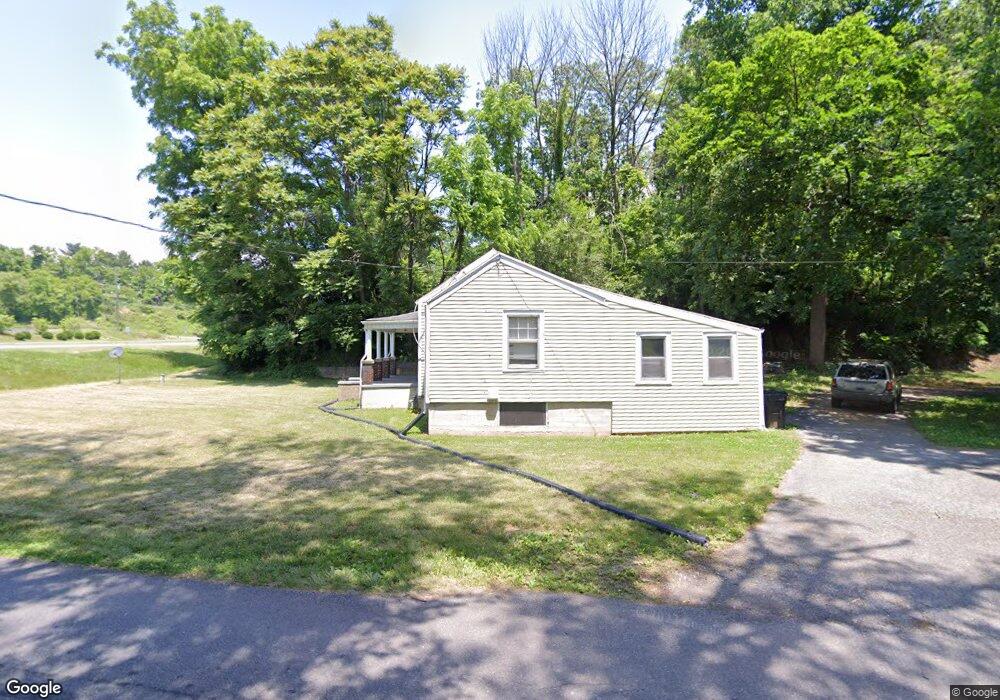
4165 Carson Rd Roanoke, VA 24012
Estimated Value: $125,000 - $267,000
1
Bed
1
Bath
1,681
Sq Ft
$121/Sq Ft
Est. Value
About This Home
This home is located at 4165 Carson Rd, Roanoke, VA 24012 and is currently estimated at $202,989, approximately $120 per square foot. 4165 Carson Rd is a home located in Roanoke County with nearby schools including Bonsack Elementary School, William Byrd Middle School, and William Byrd High School.
Ownership History
Date
Name
Owned For
Owner Type
Purchase Details
Closed on
Mar 17, 2022
Sold by
Douglas Shropshire Melvin and Douglas Anna Jo
Bought by
Shropshire Melvin Douglas and Shropshire Jo Ann
Current Estimated Value
Purchase Details
Closed on
Apr 4, 2013
Sold by
Shropshire Melvin Douglas and Shropshire M
Bought by
Shropshire Melvin Douglas and Shropshire Jo Anna
Home Financials for this Owner
Home Financials are based on the most recent Mortgage that was taken out on this home.
Original Mortgage
$655,000
Interest Rate
3.64%
Mortgage Type
Purchase Money Mortgage
Purchase Details
Closed on
Aug 8, 2007
Sold by
Foutz Christopher Lynn
Bought by
Shropshire Melvin Douglas and Shropshire Joanna
Home Financials for this Owner
Home Financials are based on the most recent Mortgage that was taken out on this home.
Original Mortgage
$58,500
Interest Rate
7.25%
Mortgage Type
New Conventional
Create a Home Valuation Report for This Property
The Home Valuation Report is an in-depth analysis detailing your home's value as well as a comparison with similar homes in the area
Purchase History
| Date | Buyer | Sale Price | Title Company |
|---|---|---|---|
| Shropshire Melvin Douglas | -- | Colonial Title | |
| Shropshire Melvin Douglas | -- | Colonial Title & Settlement | |
| Shropshire Melvin Douglas | $65,000 | Multiple |
Source: Public Records
Mortgage History
| Date | Status | Borrower | Loan Amount |
|---|---|---|---|
| Previous Owner | Shropshire Melvin Douglas | $655,000 | |
| Previous Owner | Shropshire Melvin Douglas | $58,500 |
Source: Public Records
Tax History
| Year | Tax Paid | Tax Assessment Tax Assessment Total Assessment is a certain percentage of the fair market value that is determined by local assessors to be the total taxable value of land and additions on the property. | Land | Improvement |
|---|---|---|---|---|
| 2025 | $1,249 | $121,300 | $52,500 | $68,800 |
| 2024 | $1,253 | $120,500 | $52,500 | $68,000 |
| 2023 | $1,232 | $116,200 | $52,500 | $63,700 |
| 2022 | $1,218 | $111,700 | $52,500 | $59,200 |
| 2021 | $1,218 | $93,700 | $42,000 | $51,700 |
| 2020 | $912 | $83,700 | $33,600 | $50,100 |
| 2019 | $900 | $82,600 | $33,600 | $49,000 |
| 2018 | $841 | $77,200 | $33,600 | $43,600 |
| 2017 | $831 | $76,200 | $33,600 | $42,600 |
| 2016 | $835 | $76,600 | $33,600 | $43,000 |
| 2015 | $829 | $76,100 | $33,600 | $42,500 |
| 2014 | $834 | $76,500 | $33,600 | $42,900 |
Source: Public Records
Map
Nearby Homes
- 5018 Carter Grove Ln
- 5255 Dresden Cir
- 5114 Huntridge Rd
- 4477 Bonsack Rd NE
- 4129 Blue View Dr
- 0 E Ruritan Rd
- 3827 Alexandra Ct
- 5030 Jonathan Ln
- 3009 Mystique Ct
- 2951 Mystique Ct
- 1921 Bloomfield Ave
- 3035 Moyer Ct
- 3040 Moyer Ct
- 3706 Derby Dr
- 5181 Crumpacker Dr
- 5615 Huntridge Rd
- 5631 Huntridge Rd
- 5655 Huntridge Rd
- 5671 Huntridge Rd
- 5639 Huntridge Rd
- 4125 Carson Rd
- 4183 Challenger Ave
- 4065 Challenger Ave
- 4111 Carson Rd
- 4103 Carson Rd
- 4120 Challenger Ave
- 4053 Challenger Ave
- 3940 Valley Gateway Blvd
- 4095 Carson Rd
- 4185 Challenger Ave
- 3108 E Ruritan Rd
- 3100 E Ruritan Rd
- 4107 Carson Rd
- 4100 Challenger Ave
- 3060 E Ruritan Rd
- 4257 Bonsack Rd
- 3040 E Ruritan Rd
- 4247 Bonsack Rd
- 5448 Setter Rd
- 5440 Setter Rd
Your Personal Tour Guide
Ask me questions while you tour the home.