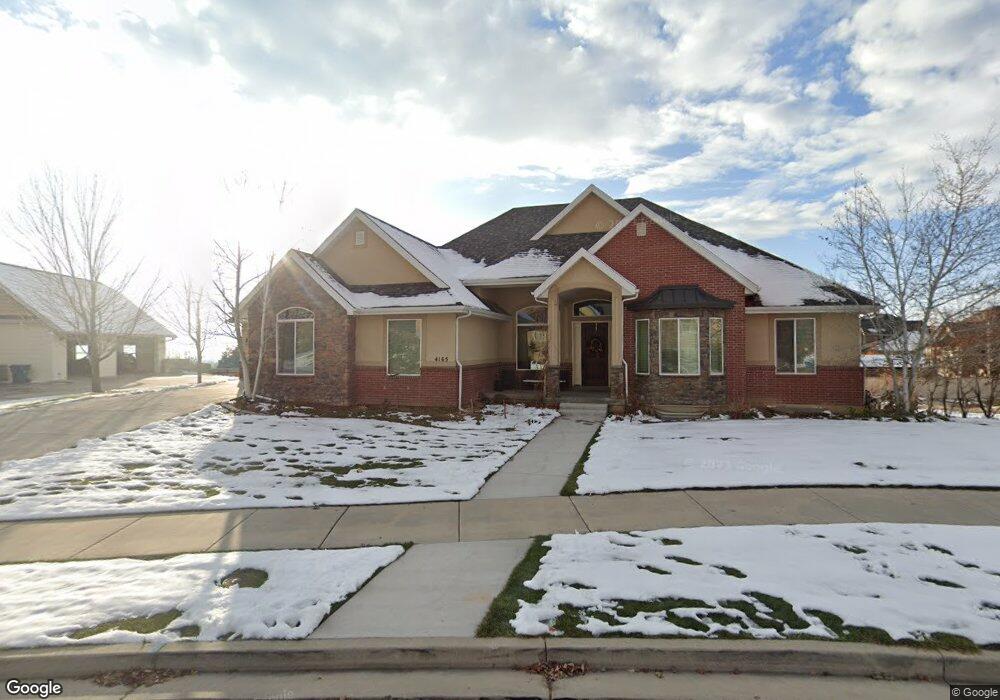
4165 N 810 W Unit 11 Pleasant Grove, UT 84062
Estimated Value: $1,202,000 - $1,690,477
3
Beds
5
Baths
2,483
Sq Ft
$585/Sq Ft
Est. Value
About This Home
This home is located at 4165 N 810 W Unit 11, Pleasant Grove, UT 84062 and is currently estimated at $1,453,369, approximately $585 per square foot. 4165 N 810 W Unit 11 is a home located in Utah County with nearby schools including Deerfield Elementary School, Mountain Ridge Junior High School, and American Fork High School.
Ownership History
Date
Name
Owned For
Owner Type
Purchase Details
Closed on
Jun 15, 2012
Sold by
Dominion Homes Llc
Bought by
Turner Kent S and Turner Jackee
Current Estimated Value
Home Financials for this Owner
Home Financials are based on the most recent Mortgage that was taken out on this home.
Original Mortgage
$834,000
Outstanding Balance
$576,906
Interest Rate
3.79%
Mortgage Type
Reverse Mortgage Home Equity Conversion Mortgage
Estimated Equity
$876,463
Purchase Details
Closed on
Oct 7, 2011
Sold by
Mpb Group Inc
Bought by
Dominion Homes Llc
Purchase Details
Closed on
Sep 13, 2011
Sold by
Rs Properties Inc
Bought by
Mpb Group Inc
Purchase Details
Closed on
Jun 19, 2007
Sold by
Dgd Construction
Bought by
Rs Properties Inc
Create a Home Valuation Report for This Property
The Home Valuation Report is an in-depth analysis detailing your home's value as well as a comparison with similar homes in the area
Home Values in the Area
Average Home Value in this Area
Purchase History
| Date | Buyer | Sale Price | Title Company |
|---|---|---|---|
| Turner Kent S | -- | Gt Title Service | |
| Dominion Homes Llc | -- | Gt Title Services Salt Lake | |
| Mpb Group Inc | -- | Gt Title Services Salt Lake | |
| Rs Properties Inc | -- | Bartlett Title Insurance Ag |
Source: Public Records
Mortgage History
| Date | Status | Borrower | Loan Amount |
|---|---|---|---|
| Open | Turner Kent S | $834,000 |
Source: Public Records
Tax History Compared to Growth
Tax History
| Year | Tax Paid | Tax Assessment Tax Assessment Total Assessment is a certain percentage of the fair market value that is determined by local assessors to be the total taxable value of land and additions on the property. | Land | Improvement |
|---|---|---|---|---|
| 2025 | $5,945 | $799,480 | $456,200 | $997,400 |
| 2024 | $5,945 | $709,665 | $0 | $0 |
| 2023 | $5,874 | $717,695 | $0 | $0 |
| 2022 | $6,485 | $788,315 | $0 | $0 |
| 2021 | $5,633 | $1,042,600 | $259,600 | $783,000 |
| 2020 | $5,320 | $965,400 | $240,400 | $725,000 |
| 2019 | $5,053 | $948,200 | $223,200 | $725,000 |
| 2018 | $4,714 | $836,400 | $206,000 | $630,400 |
| 2017 | $4,317 | $407,770 | $0 | $0 |
| 2016 | $3,858 | $351,890 | $0 | $0 |
| 2015 | $3,899 | $336,710 | $0 | $0 |
| 2014 | $3,653 | $312,510 | $0 | $0 |
Source: Public Records
Map
Nearby Homes
- 4124 N 810 W
- 9506 N 4000 W
- 9481 N 3830 W
- 9575 Aztec Dr
- 9547 N Canyon Rd
- 3851 W Mountaintop Cir Unit 5
- 3810 W Valley View Dr
- 9900 N Meadow Dr
- 3870 Mountaintop Cir
- 4441 W Bridgestone Dr
- 248 N Deerfield Ln
- 4198 W Sage Rd N
- 9587 N 4500 W
- 1243 N 1270 E
- 1172 Murdock Dr
- 9681 N Peach Ct
- 9157 N Canyon Heights Dr
- 1125 N 1270 E
- 10207 N Cottonwood Dr
- 4631 W Harvey Blvd