Estimated Value: $472,000 - $489,000
4
Beds
2
Baths
3,262
Sq Ft
$147/Sq Ft
Est. Value
About This Home
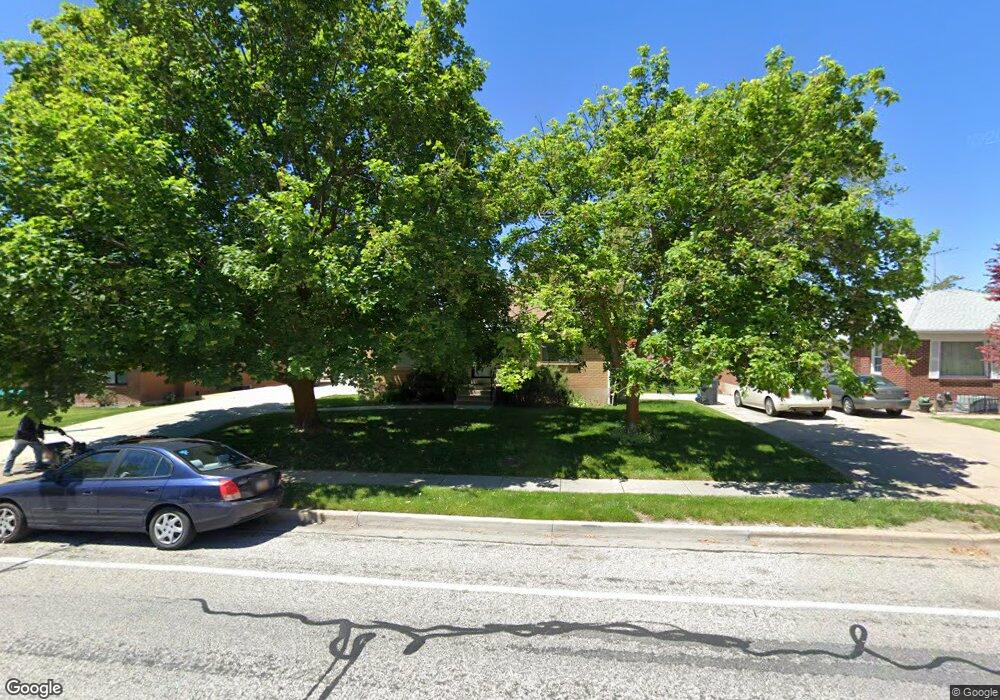
This home is located at 4169 Monroe Blvd, Ogden, UT 84403 and is currently estimated at $479,889, approximately $147 per square foot. 4169 Monroe Blvd is a home located in Weber County with nearby schools including Burch Creek School, South Ogden Junior High School, and Bonneville High School.
Ownership History
Date
Name
Owned For
Owner Type
Purchase Details
Closed on
Feb 27, 2025
Sold by
Phelps Joshua R
Bought by
Floater Property Llc
Current Estimated Value
Purchase Details
Closed on
May 9, 2014
Sold by
Taylor Denise
Bought by
Phelps Joshua R
Home Financials for this Owner
Home Financials are based on the most recent Mortgage that was taken out on this home.
Original Mortgage
$209,000
Interest Rate
4.23%
Mortgage Type
New Conventional
Purchase Details
Closed on
Nov 10, 2006
Sold by
Family Trust Of Roy & Fay W Van Drimmele
Bought by
Taylor Douglas and Taylor Denise
Purchase Details
Closed on
Nov 1, 2000
Sold by
Vandrimmelen Leroy and Vandrimmelen Fay
Bought by
The Family Trust Of Roy Vandrimmelen and Vandrimmelen Fay W
Create a Home Valuation Report for This Property
The Home Valuation Report is an in-depth analysis detailing your home's value as well as a comparison with similar homes in the area
Home Values in the Area
Average Home Value in this Area
Purchase History
| Date | Buyer | Sale Price | Title Company |
|---|---|---|---|
| Floater Property Llc | -- | None Listed On Document | |
| Phelps Joshua R | -- | Us Title Insurance Agency | |
| Taylor Douglas | -- | First American Title | |
| The Family Trust Of Roy Vandrimmelen | -- | -- |
Source: Public Records
Mortgage History
| Date | Status | Borrower | Loan Amount |
|---|---|---|---|
| Previous Owner | Phelps Joshua R | $209,000 |
Source: Public Records
Tax History
| Year | Tax Paid | Tax Assessment Tax Assessment Total Assessment is a certain percentage of the fair market value that is determined by local assessors to be the total taxable value of land and additions on the property. | Land | Improvement |
|---|---|---|---|---|
| 2025 | $3,469 | $488,811 | $139,514 | $349,297 |
| 2024 | $3,363 | $262,347 | $76,732 | $185,615 |
| 2023 | $3,077 | $239,251 | $74,138 | $165,113 |
| 2022 | $3,091 | $249,149 | $57,464 | $191,685 |
| 2021 | $2,552 | $341,000 | $67,905 | $273,095 |
| 2020 | $2,351 | $291,001 | $51,433 | $239,568 |
| 2019 | $2,231 | $262,000 | $47,328 | $214,672 |
| 2018 | $2,228 | $250,000 | $47,328 | $202,672 |
| 2017 | $2,014 | $214,000 | $47,328 | $166,672 |
| 2016 | $1,787 | $104,135 | $22,680 | $81,455 |
| 2015 | $1,815 | $104,135 | $22,680 | $81,455 |
| 2014 | $1,653 | $92,335 | $22,680 | $69,655 |
Source: Public Records
Map
Nearby Homes
- 4180 Liberty Ave
- 4079 S 895 E Unit 67
- 225 E 40th St S
- 920 E 4050 S
- 3878 Grandview Dr
- 3868 Grandview Dr
- 964 40th St
- 904 39th St
- 4014 Porter Ave
- 1070 40th St
- 3874 Orchard Ave
- 3845 Nordin Ave
- 1113 Country Hills Dr Unit G2
- 3828 Quincy Ave
- 3813 Grandview Dr
- 1079 E 4525 S
- 3760 Jefferson Ave
- 796 Nancy Dr
- 668 37th St
- 3715 Van Buren Ave
- 4147 Monroe Blvd
- 4173 Monroe Blvd
- 4177 Monroe Blvd
- 4137 Monroe Blvd
- 4168 Monroe Blvd
- 4168 Monroe Blvd
- 4127 Monroe Blvd
- 4180 Monroe Blvd
- 4189 Monroe Blvd
- 798 42nd St
- 4196 Monroe Blvd
- 4150 Monroe Blvd
- 785 41st St
- 4115 Monroe Blvd
- 804 42nd St
- 794 42nd St
- 785 E 4100 S
- 775 41st St
- 4134 Monroe Blvd
- 4124 Monroe Blvd
Your Personal Tour Guide
Ask me questions while you tour the home.