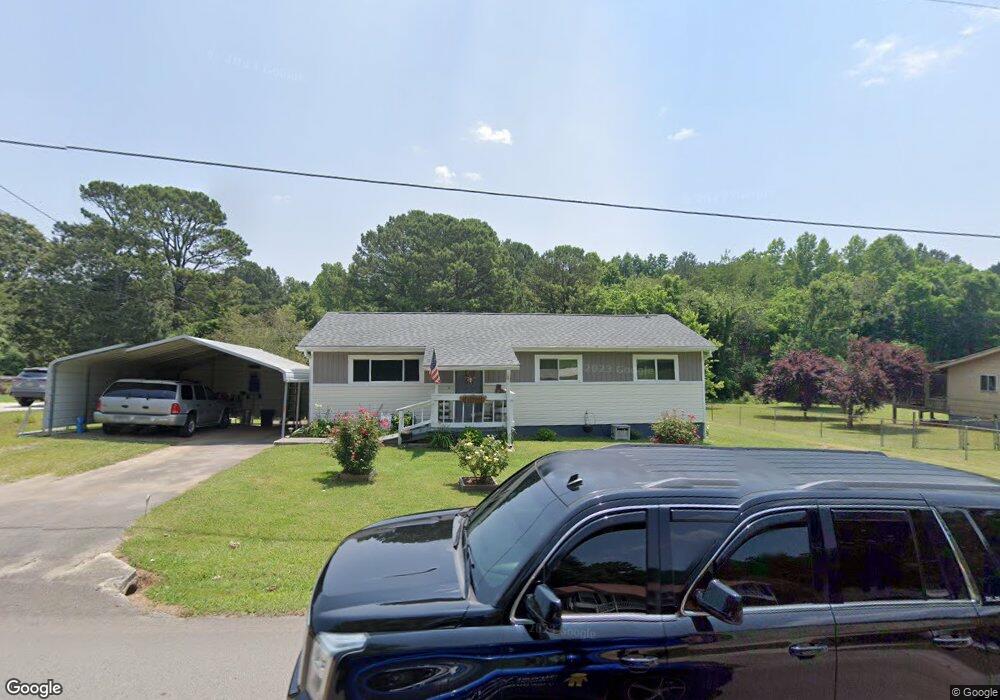
4169 N Marble Top Rd Chickamauga, GA 30707
High Point NeighborhoodEstimated Value: $51,369 - $204,000
--
Bed
2
Baths
1,136
Sq Ft
$137/Sq Ft
Est. Value
About This Home
This home is located at 4169 N Marble Top Rd, Chickamauga, GA 30707 and is currently estimated at $155,842, approximately $137 per square foot. 4169 N Marble Top Rd is a home located in Walker County with nearby schools including Chattanooga Valley Elementary School, Chattanooga Valley Middle School, and Ridgeland High School.
Ownership History
Date
Name
Owned For
Owner Type
Purchase Details
Closed on
Sep 13, 2021
Sold by
White Edward L
Bought by
White Edward L and White Polly A
Current Estimated Value
Home Financials for this Owner
Home Financials are based on the most recent Mortgage that was taken out on this home.
Original Mortgage
$87,000
Outstanding Balance
$65,968
Interest Rate
2.8%
Mortgage Type
New Conventional
Estimated Equity
$89,874
Purchase Details
Closed on
Feb 10, 2020
Sold by
White Lisa F
Bought by
White Edward L
Purchase Details
Closed on
Apr 28, 1990
Sold by
White Edgar L and White Willie
Bought by
White Edward L and White Lisa
Purchase Details
Closed on
Jun 28, 1973
Sold by
Secretary Of Housing & Urban
Bought by
White Edgar L and White Willie
Purchase Details
Closed on
Dec 21, 1971
Sold by
Carruth Raymond H and Carruth Frances J
Bought by
Secretary Of Housing & Urban
Purchase Details
Closed on
Apr 27, 1971
Bought by
Carruth Raymond H and Carruth Frances J
Create a Home Valuation Report for This Property
The Home Valuation Report is an in-depth analysis detailing your home's value as well as a comparison with similar homes in the area
Home Values in the Area
Average Home Value in this Area
Purchase History
| Date | Buyer | Sale Price | Title Company |
|---|---|---|---|
| White Edward L | -- | -- | |
| White Edward L | -- | -- | |
| White Edward L | -- | -- | |
| White Edgar L | -- | -- | |
| Secretary Of Housing & Urban | -- | -- | |
| Carruth Raymond H | -- | -- |
Source: Public Records
Mortgage History
| Date | Status | Borrower | Loan Amount |
|---|---|---|---|
| Open | White Edward L | $87,000 |
Source: Public Records
Tax History Compared to Growth
Tax History
| Year | Tax Paid | Tax Assessment Tax Assessment Total Assessment is a certain percentage of the fair market value that is determined by local assessors to be the total taxable value of land and additions on the property. | Land | Improvement |
|---|---|---|---|---|
| 2024 | $1,062 | $46,450 | $2,800 | $43,650 |
| 2023 | $1,032 | $44,118 | $2,800 | $41,318 |
| 2022 | $955 | $38,214 | $2,800 | $35,414 |
| 2021 | $730 | $25,955 | $2,800 | $23,155 |
| 2020 | $635 | $21,516 | $2,800 | $18,716 |
| 2019 | $644 | $21,516 | $2,800 | $18,716 |
| 2018 | $569 | $21,516 | $2,800 | $18,716 |
| 2017 | $704 | $21,516 | $2,800 | $18,716 |
| 2016 | $608 | $21,516 | $2,800 | $18,716 |
| 2015 | $680 | $23,114 | $2,800 | $20,314 |
| 2014 | $598 | $23,114 | $2,800 | $20,314 |
| 2013 | -- | $23,113 | $2,800 | $20,313 |
Source: Public Records
Map
Nearby Homes
- 0 Mount Dr
- 458 Boss Rd
- 0 Maple Hill Rd Unit 7527469
- 0 Maple Hill Rd Unit LOT 9A 10467227
- 2423 N Marble Top Rd
- 0 Cloudland Unit 1510868
- 0 Cloudland Unit 1520617
- 7820 Highway 193
- 206 Cottage Crest Ct
- 60 Red Oak Ridge Dr
- 57 Fir St
- 930 Kensington Rd
- 852 Old Grand Center Rd
- 146 Fescue Dr
- 15 Fescue Dr
- 997 W 12th St
- 997 W West 12th St
- 1907 Grand Center Rd
- 77 Garretts Chapel Rd
- 810 Marble Top Rd
- 4175 N Marble Top Rd
- 4161 N Marble Top Rd
- 4225 N Marble Top Rd
- 4153 N Marble Top Rd
- 4184 N Marble Top Rd
- 4243 N Marble Top Rd
- 4149 N Marble Top Rd
- 4259 N Marble Top Rd
- 4129 N Marble Top Rd
- 4244 N Marble Top Rd
- 4107 N Marble Top Rd
- 4041 N Marble Top Rd
- 4156 N Marble Top Rd
- 4025 N Marble Top Rd
- 4283 N Marble Top Rd
- 4005 N Marble Top Rd
- 4078 N Marble Top Rd
- 3983 N Marble Top Rd
- 4287 N Marble Top Rd
- 919 Lisbon Rd