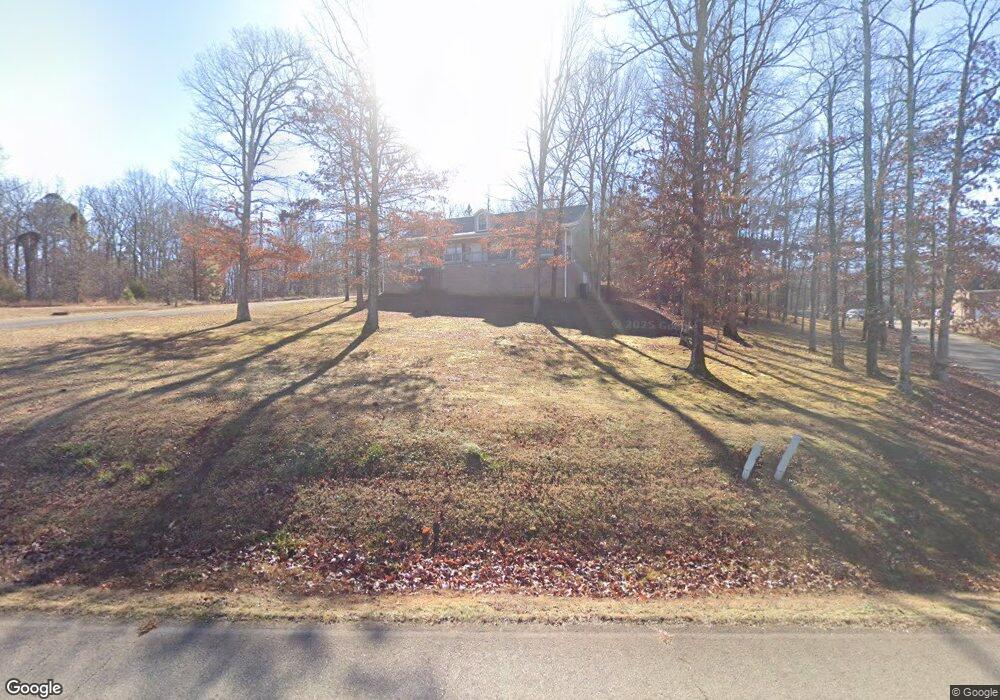
4169 Peeler Bend Rd Benton, AR 72019
Estimated Value: $384,000 - $542,000
--
Bed
3
Baths
2,799
Sq Ft
$160/Sq Ft
Est. Value
About This Home
This home is located at 4169 Peeler Bend Rd, Benton, AR 72019 and is currently estimated at $447,330, approximately $159 per square foot. 4169 Peeler Bend Rd is a home located in Saline County with nearby schools including Ringgold Elementary School, Benton Middle School, and Benton Junior High School.
Ownership History
Date
Name
Owned For
Owner Type
Purchase Details
Closed on
Apr 3, 2009
Sold by
Dickson Terri Melinda
Bought by
Shelton Randal S
Current Estimated Value
Home Financials for this Owner
Home Financials are based on the most recent Mortgage that was taken out on this home.
Original Mortgage
$220,825
Outstanding Balance
$141,089
Interest Rate
5.14%
Mortgage Type
FHA
Estimated Equity
$306,241
Purchase Details
Closed on
Apr 7, 2008
Sold by
Montgomery Michael and Montgomery Terri Melinda
Bought by
Montgomery Terri Melinda
Purchase Details
Closed on
May 26, 2006
Sold by
Newell Mark and Newell Kris
Bought by
Montgomery Michael and Montgomery Terri
Home Financials for this Owner
Home Financials are based on the most recent Mortgage that was taken out on this home.
Original Mortgage
$159,920
Interest Rate
6.5%
Mortgage Type
New Conventional
Purchase Details
Closed on
Sep 29, 2003
Bought by
Newell
Create a Home Valuation Report for This Property
The Home Valuation Report is an in-depth analysis detailing your home's value as well as a comparison with similar homes in the area
Home Values in the Area
Average Home Value in this Area
Purchase History
| Date | Buyer | Sale Price | Title Company |
|---|---|---|---|
| Shelton Randal S | $225,000 | -- | |
| Montgomery Terri Melinda | -- | None Available | |
| Montgomery Michael | $200,000 | -- | |
| Newell | $17,000 | -- |
Source: Public Records
Mortgage History
| Date | Status | Borrower | Loan Amount |
|---|---|---|---|
| Open | Shelton Randal S | $220,825 | |
| Previous Owner | Montgomery Michael | $159,920 |
Source: Public Records
Tax History Compared to Growth
Tax History
| Year | Tax Paid | Tax Assessment Tax Assessment Total Assessment is a certain percentage of the fair market value that is determined by local assessors to be the total taxable value of land and additions on the property. | Land | Improvement |
|---|---|---|---|---|
| 2025 | $3,117 | $65,506 | $6,400 | $59,106 |
| 2024 | $3,117 | $65,506 | $6,400 | $59,106 |
| 2023 | $2,651 | $65,506 | $6,400 | $59,106 |
| 2022 | $2,566 | $65,506 | $6,400 | $59,106 |
| 2021 | $2,430 | $52,520 | $4,400 | $48,120 |
| 2020 | $2,385 | $52,520 | $4,400 | $48,120 |
| 2019 | $2,385 | $52,520 | $4,400 | $48,120 |
| 2018 | $2,185 | $49,770 | $4,400 | $45,370 |
| 2017 | $2,072 | $49,770 | $4,400 | $45,370 |
| 2016 | $2,259 | $43,780 | $4,400 | $39,380 |
| 2015 | $1,959 | $43,780 | $4,400 | $39,380 |
| 2014 | $1,959 | $43,780 | $4,400 | $39,380 |
Source: Public Records
Map
Nearby Homes
- 2281 Lookout Mountain Rd
- 402 Demuth Ln
- 3550 Sam Claar Ln Unit (4301 Quapaw)
- 5812 & 5806 Highway 5
- 5806 Highway 5
- 5812 Highway 5 Unit 5806
- 0000 Grandview Dr
- 2008 Canyon Creek Pkwy
- 2048 Canyon Creek Pkwy
- 3009 Grandview Dr
- 1008 Granite Cove
- 1016 Granite Cove
- 2049 Canyon Creek Pkwy
- 1001 Granite Cove
- 2000 Canyon Creek Pkwy
- 2024 Canyon Creek Pkwy
- 2057 Canyon Creek Pkwy
- 5016 Skilling Cove
- Lot 6 Overlook Estates Highway 5
- Lot 5 Overlook Estates Highway 5
- 4201 Peeler Bend Rd Unit B
- 4201 Peeler Bend Rd
- 4223 Peeler Bend Rd
- 3897 Peeler Bend Rd
- 2300 Lookout Mountain Rd
- 4713 Brooke Cove
- 3944 Peeler Bend Rd
- 4501 Susan Trail
- 4401 Peeler Bend Rd
- 2264 Lookout Mountain Rd
- 2288 Lookout Mountain Rd
- 3898 Peeler Bend Rd
- 2242 Lookout Mountain Rd
- 2193 Lookout Mountain Rd
- 4999 Brooke Cove
- 0 Lookout Mountain Rd Unit 17012760
- 0 Lookout Mountain Rd Unit 21001308
- 3799 Peeler Bend Rd
- 2228 Lookout Mountain Rd
- 4901 Susan Trail