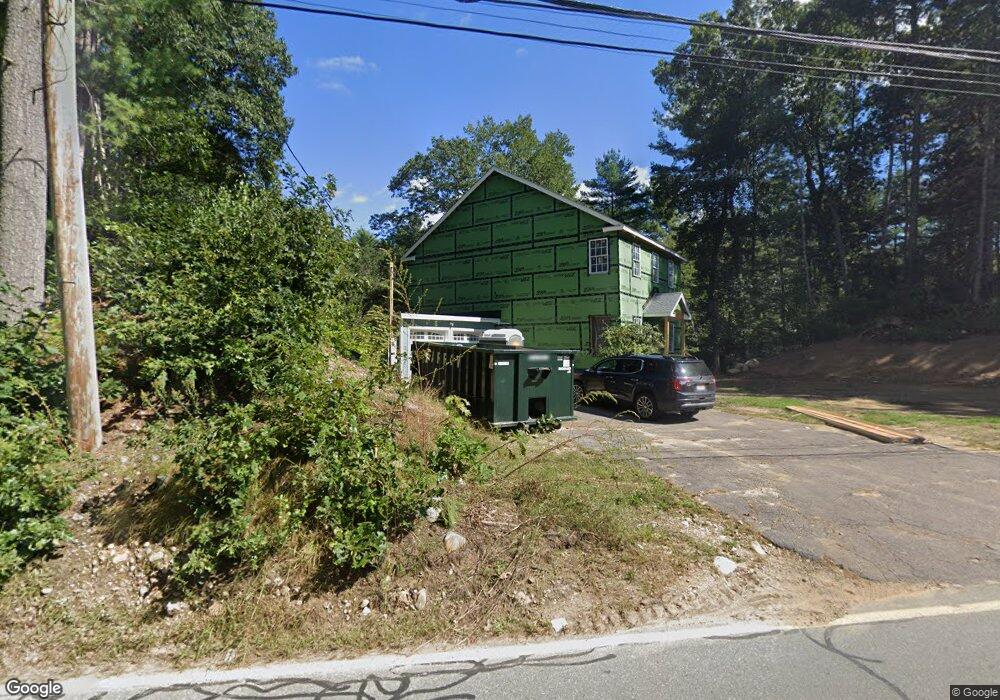
417 Andover St Wilmington, MA 01887
Estimated Value: $751,000 - $1,104,000
2
Beds
1
Bath
1,419
Sq Ft
$650/Sq Ft
Est. Value
About This Home
This home is located at 417 Andover St, Wilmington, MA 01887 and is currently estimated at $921,676, approximately $649 per square foot. 417 Andover St is a home located in Middlesex County with nearby schools including Wilmington Middle School, Wilmington High School, and Andover School of Montessori.
Ownership History
Date
Name
Owned For
Owner Type
Purchase Details
Closed on
Jun 1, 2010
Sold by
Chisholm Lisa P
Bought by
Romano David M
Current Estimated Value
Home Financials for this Owner
Home Financials are based on the most recent Mortgage that was taken out on this home.
Original Mortgage
$252,500
Outstanding Balance
$170,549
Interest Rate
5.13%
Mortgage Type
Purchase Money Mortgage
Estimated Equity
$751,127
Purchase Details
Closed on
Feb 9, 2005
Sold by
Chisholm Leland B
Bought by
Chisholm Lisa Patsy
Purchase Details
Closed on
Sep 26, 2003
Sold by
Macphee John Darren
Bought by
Macphee Lisa C
Purchase Details
Closed on
Dec 23, 1993
Sold by
Chisholm Est Leland B and Chisholm Leland
Bought by
Macphee John D
Home Financials for this Owner
Home Financials are based on the most recent Mortgage that was taken out on this home.
Original Mortgage
$76,000
Interest Rate
7%
Mortgage Type
Purchase Money Mortgage
Create a Home Valuation Report for This Property
The Home Valuation Report is an in-depth analysis detailing your home's value as well as a comparison with similar homes in the area
Purchase History
| Date | Buyer | Sale Price | Title Company |
|---|---|---|---|
| Romano David M | $257,500 | -- | |
| Chisholm Lisa Patsy | -- | -- | |
| Macphee Lisa C | -- | -- | |
| Macphee John D | $120,000 | -- |
Source: Public Records
Mortgage History
| Date | Status | Borrower | Loan Amount |
|---|---|---|---|
| Open | Romano David M | $252,500 | |
| Previous Owner | Macphee John D | $100,750 | |
| Previous Owner | Macphee John D | $76,000 |
Source: Public Records
Tax History
| Year | Tax Paid | Tax Assessment Tax Assessment Total Assessment is a certain percentage of the fair market value that is determined by local assessors to be the total taxable value of land and additions on the property. | Land | Improvement |
|---|---|---|---|---|
| 2025 | $8,933 | $780,200 | $277,700 | $502,500 |
| 2024 | $5,934 | $519,200 | $277,700 | $241,500 |
| 2023 | $5,754 | $481,900 | $252,500 | $229,400 |
| 2022 | $5,461 | $419,100 | $210,300 | $208,800 |
| 2021 | $5,499 | $397,300 | $191,200 | $206,100 |
| 2020 | $5,295 | $389,900 | $191,200 | $198,700 |
| 2019 | $5,277 | $383,800 | $182,000 | $201,800 |
| 2018 | $5,111 | $354,700 | $173,400 | $181,300 |
| 2017 | $4,927 | $341,000 | $172,900 | $168,100 |
| 2016 | $4,714 | $322,200 | $164,700 | $157,500 |
| 2015 | $4,333 | $301,500 | $164,700 | $136,800 |
| 2014 | $4,021 | $282,400 | $156,900 | $125,500 |
Source: Public Records
Map
Nearby Homes
- 13 Taylor Cove Dr Unit 31
- 12 Parkview Terrace
- 5 Colonial Dr Unit B5-6
- 11 Cogswell Rd
- 12D Chester Rd
- 12 B Chester Rd Unit D
- 72 Tewksbury St
- 250 Martins Landing Unit 402
- 280 Martins Landing Unit 312
- 260 Martins Landing Unit 508
- 200 Martins Landing Unit 102
- 220 Martins Landing Unit 309
- 56 Sunset Rock Rd
- 320 Martins Landing Unit 401
- 320 Martins Landing Unit 2410
- 320 Martins Landing Unit 502
- 320 Martins Landing Unit 102
- 320 Martins Landing Unit 107
- 320 Martins Landing Unit 404
- 320 Martins Landing Unit 209
- 421 Andover St
- 421 Andover St
- 419 Andover St
- 420 Andover St
- 427 Andover St
- 415 Andover St
- 410 Andover St
- 2 Willard Cir
- 31 Hensey Way Unit 31
- 7 Foster Pond Rd
- 429 Andover St
- 406 Andover St
- 405 Andover St
- 29 Hensey Way Unit 29
- 25 Hensey Way Unit 25
- 8 Willard Cir
- 403 Andover St
- 18 Hensey Way Unit 18
- 16 Hensey Way Unit 16
- 404 Andover St
Your Personal Tour Guide
Ask me questions while you tour the home.